Data content views: Sequence tagging
This article explains the different ways you can view and interact with your data for sequence tagging applications. You’ll learn what types of data views are available, and how you can use each view to support sequence tagging tasks.
This page focuses specifically on sequence tagging applications. If you’re working with other application types, check out our guides for Data content views: Classification or Data content views: Candidate-based extraction.
The data content section is the main canvas to showcase your data in individual or aggregated formats. The following views are supported in sequence tagging applications:
- Record view: Inspect individual datapoints
- Snippet view: Compare small sections across datapoints
- Table view: See aggregated datapoints in a tabular format
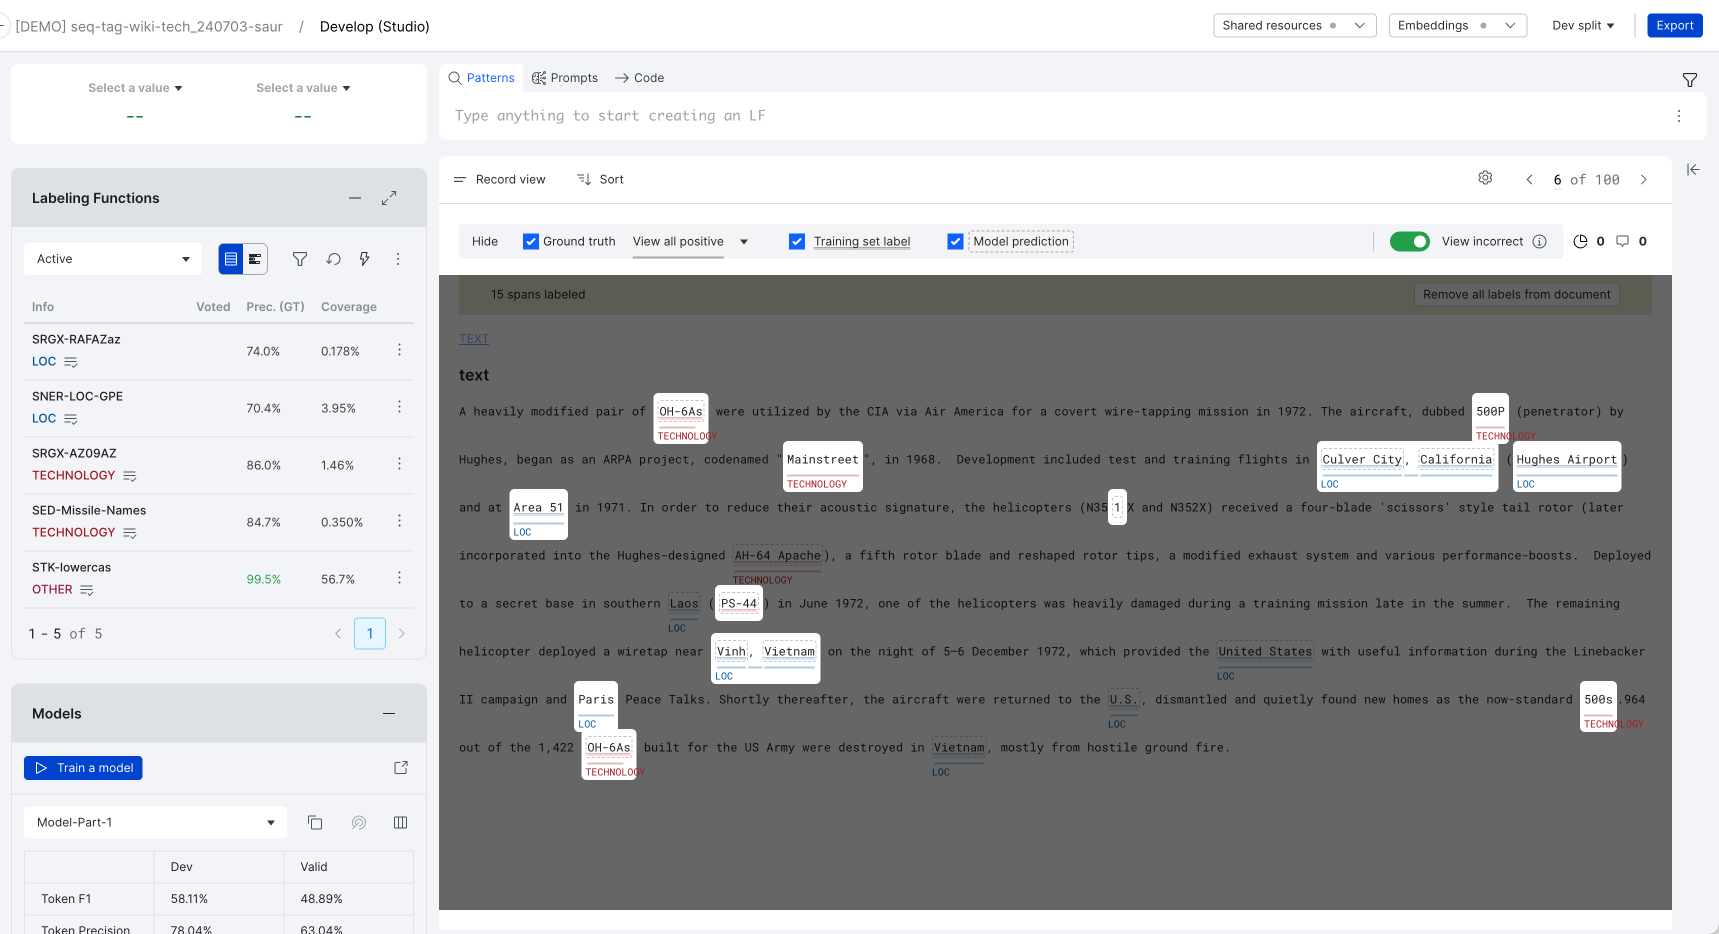
Record view: View and edit metadata
Record view is the default view of data content in sequence tagging applications. It displays each individual datapoint along with its associated fields and metadata. Use this view to:
- View metadata (e.g., ground truth, model prediction, labeling function (LF) votes, and training set label)
- Edit metadata
- Add spans
- View data content
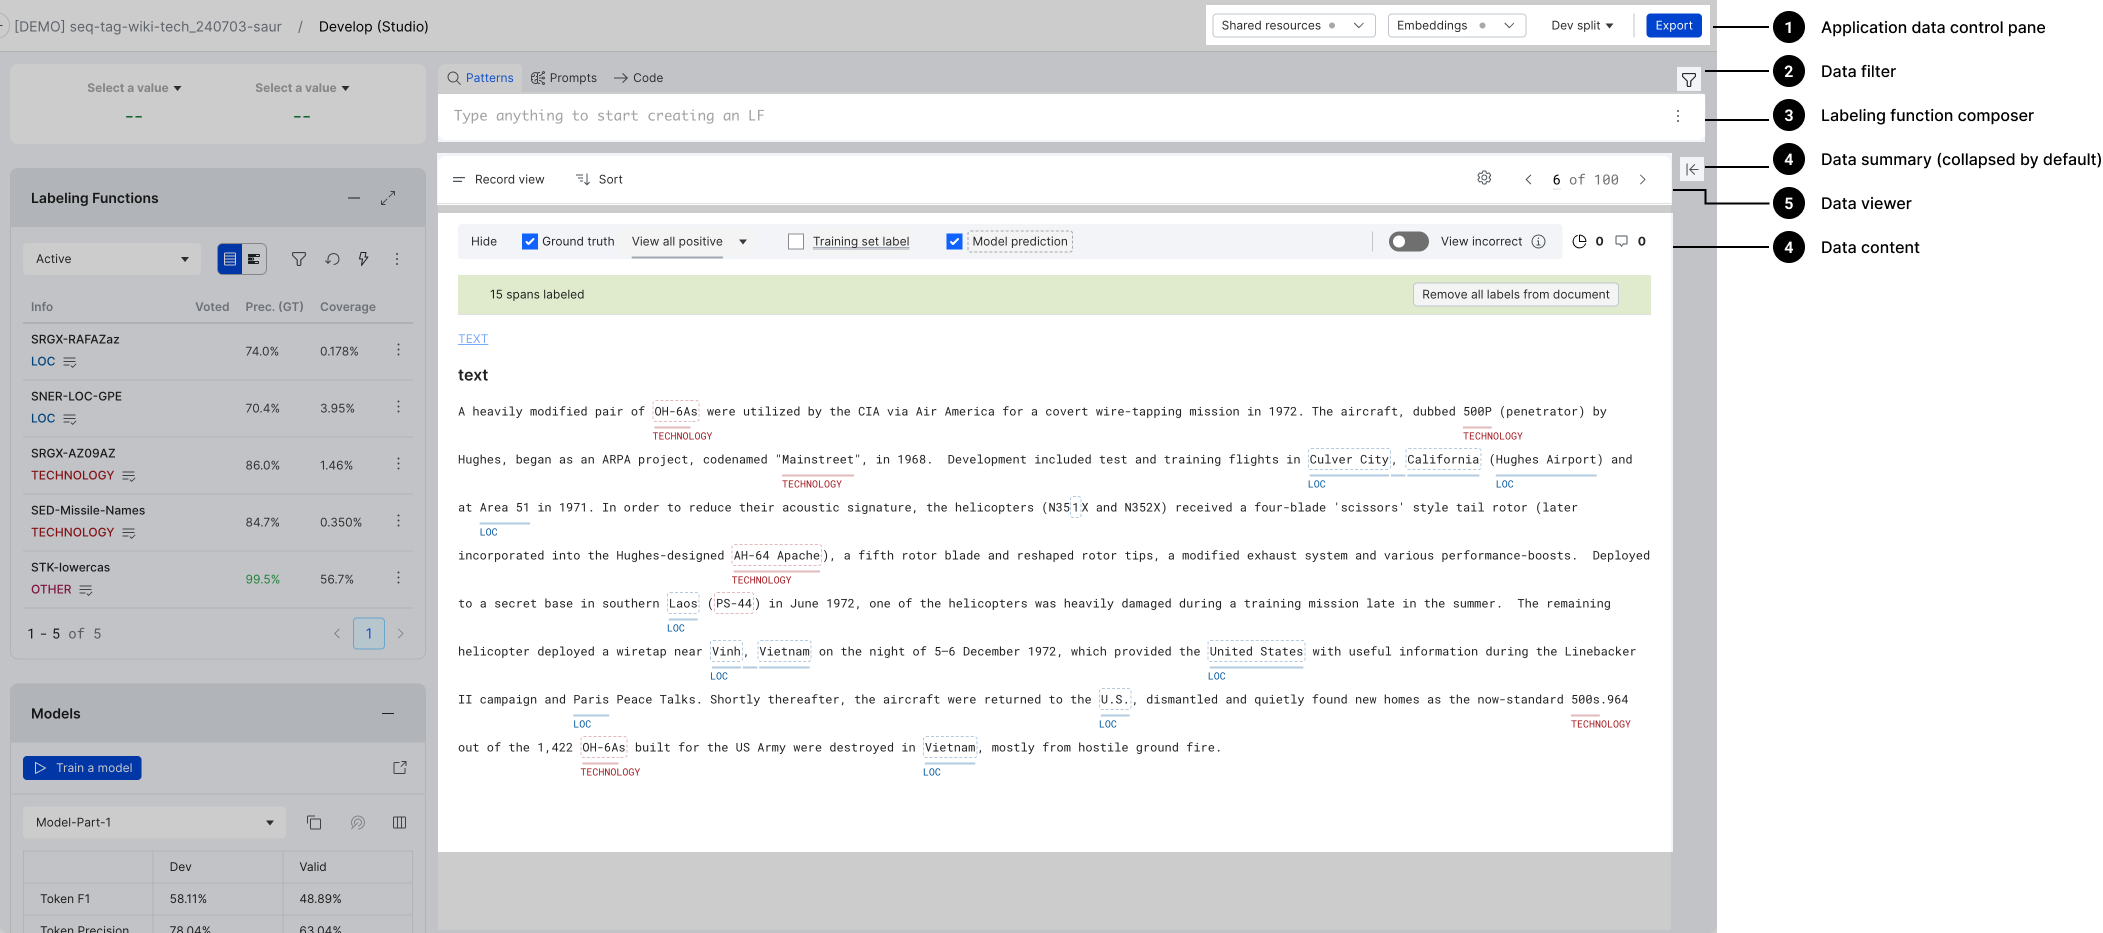
For sequence tagging applications, the Record view includes:
- A highlight control pane.
- Entry points to document-level slices and comments.
- A data content area where you can view and edit metadata associated with individual spans in a document.
The following sections walk through the actions that you can take while in the Record view.
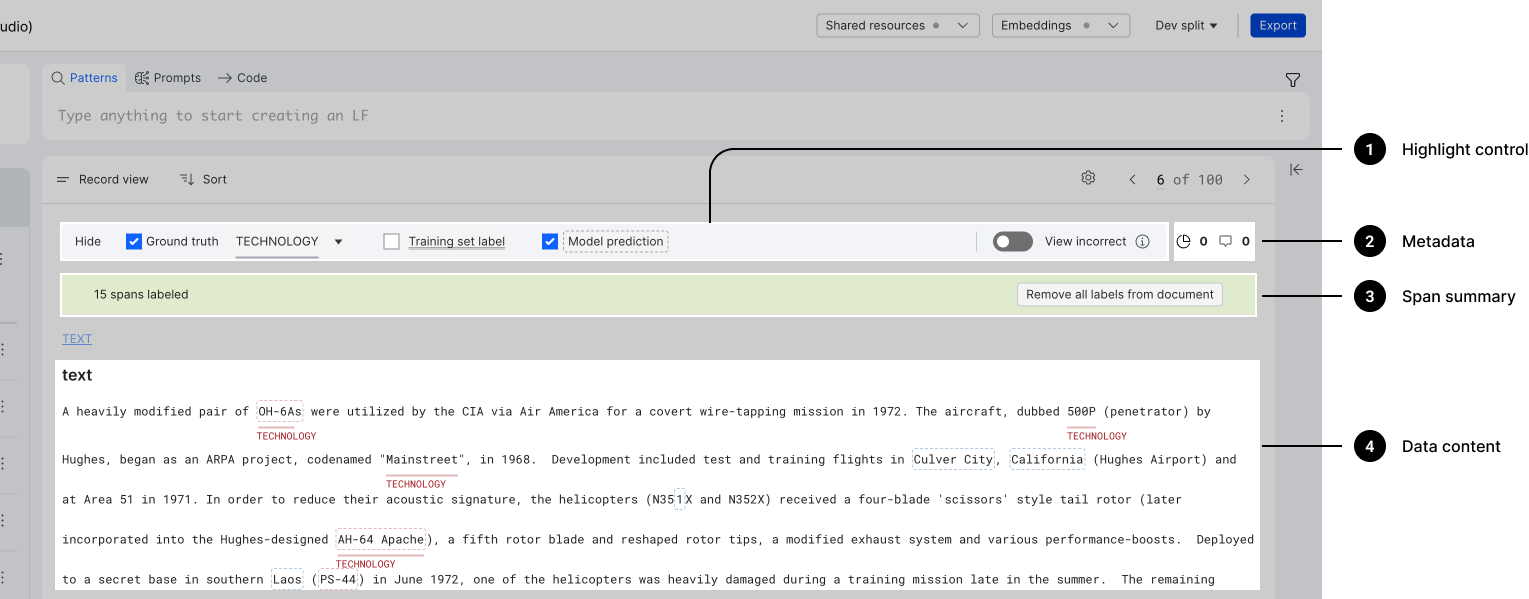
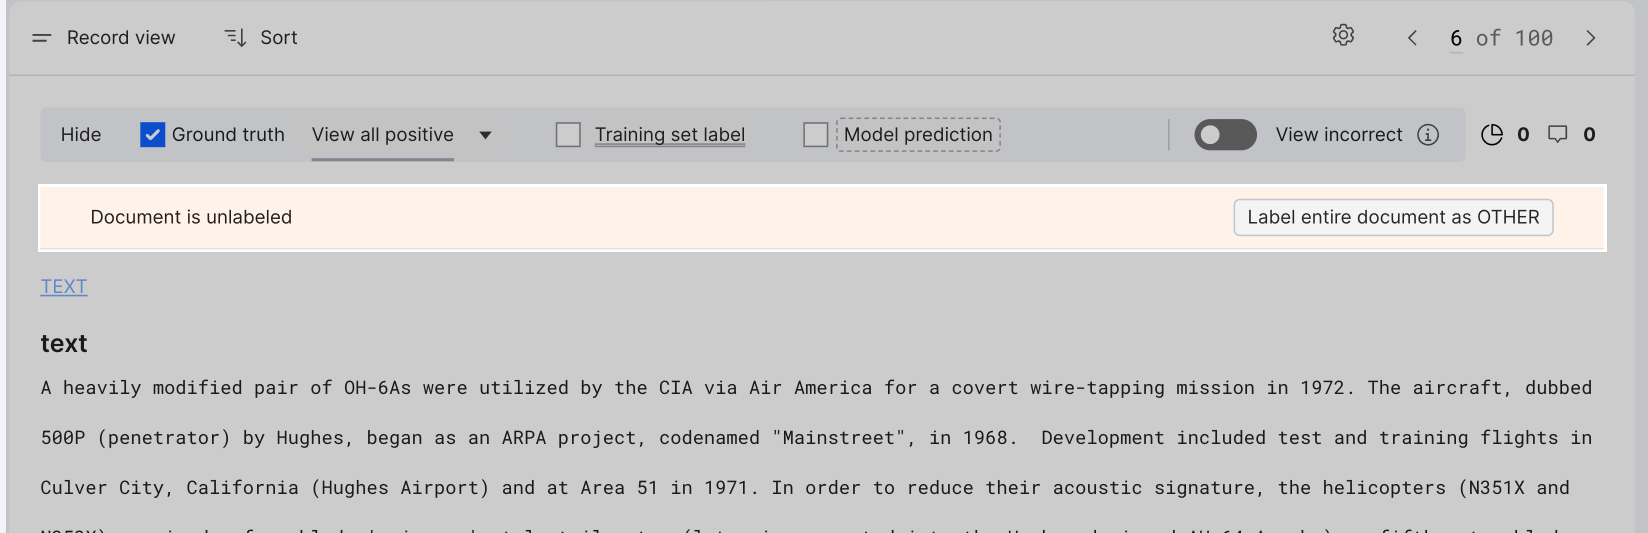
Use the highlight control pane
The Highlight control pane allows you to turn on/off highlights. Use the dropdown to select specific types of highlights, and scroll horizontally to access all available controls. The available controls include:
- Ground truth: View all labels, or view a specific label
- LF vote: See how a LF voted on spans
- Training set label: View the label applied during training
- Model prediction: Display the predictions of the current model
- Spotlight mode: Focuses on any instance where Training set (TS) and/or Model prediction (MP) disagree with Ground truth (GT).
View the ground truth of a span
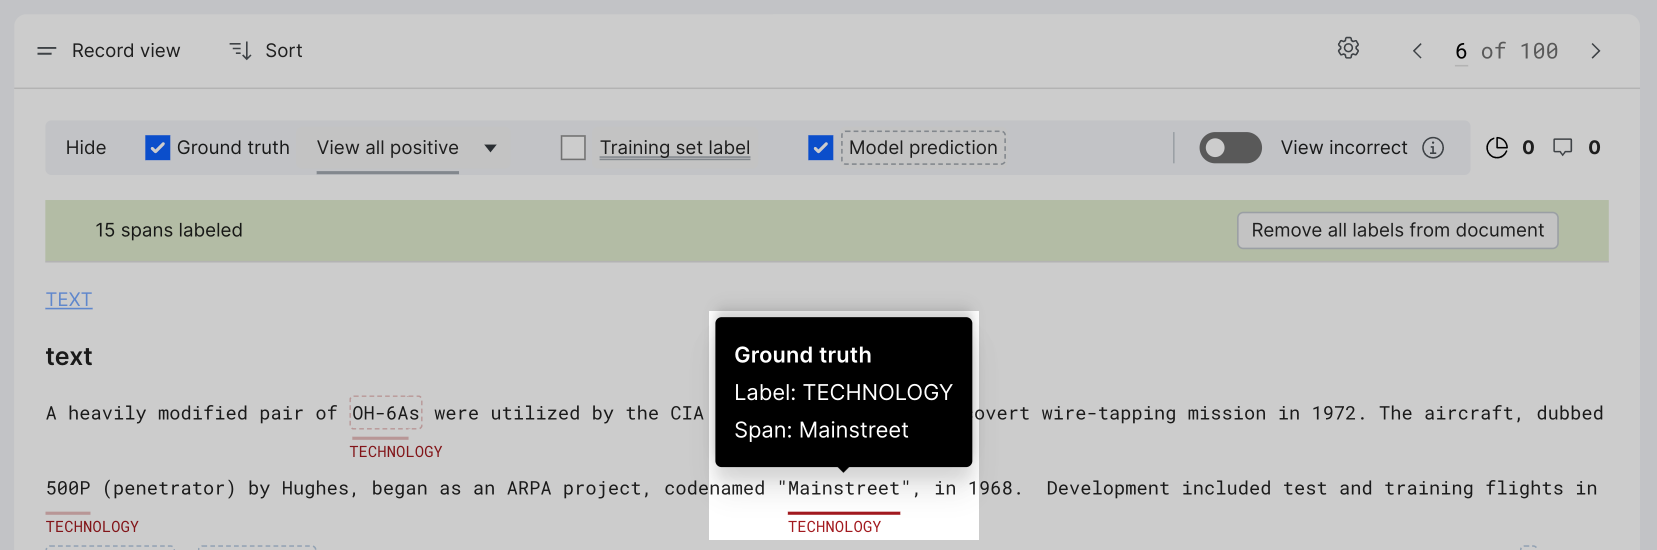
When the Ground truth highlight is turned on (in the highlight control pane), select a span highlight to see the ground truth label and span.
View information of overlapping spans
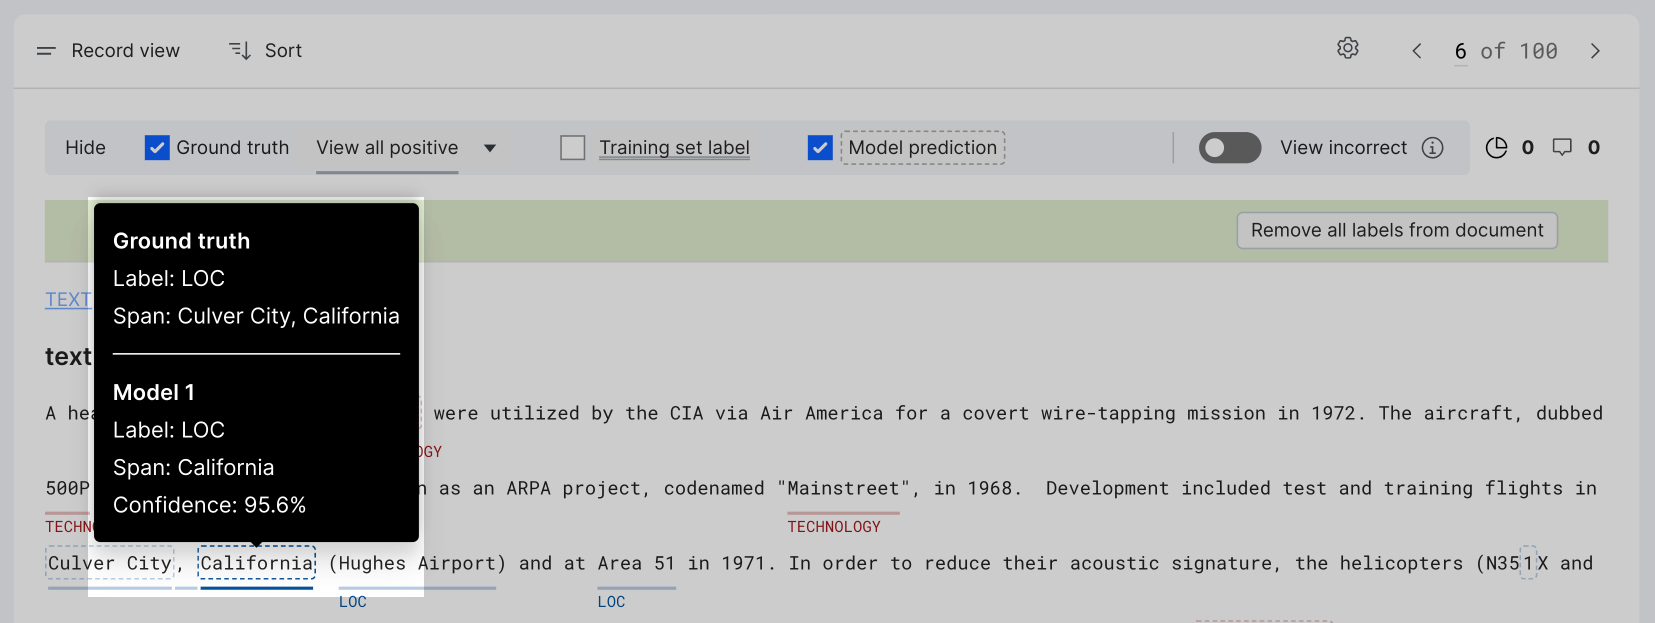
When multiple highlights are enabled (in the highlight control pane), you might encounter overlapping spans. Click anywhere in the overlapping span to show a tooltip containing full metadata information for the span.
Add or change the ground truth of a span
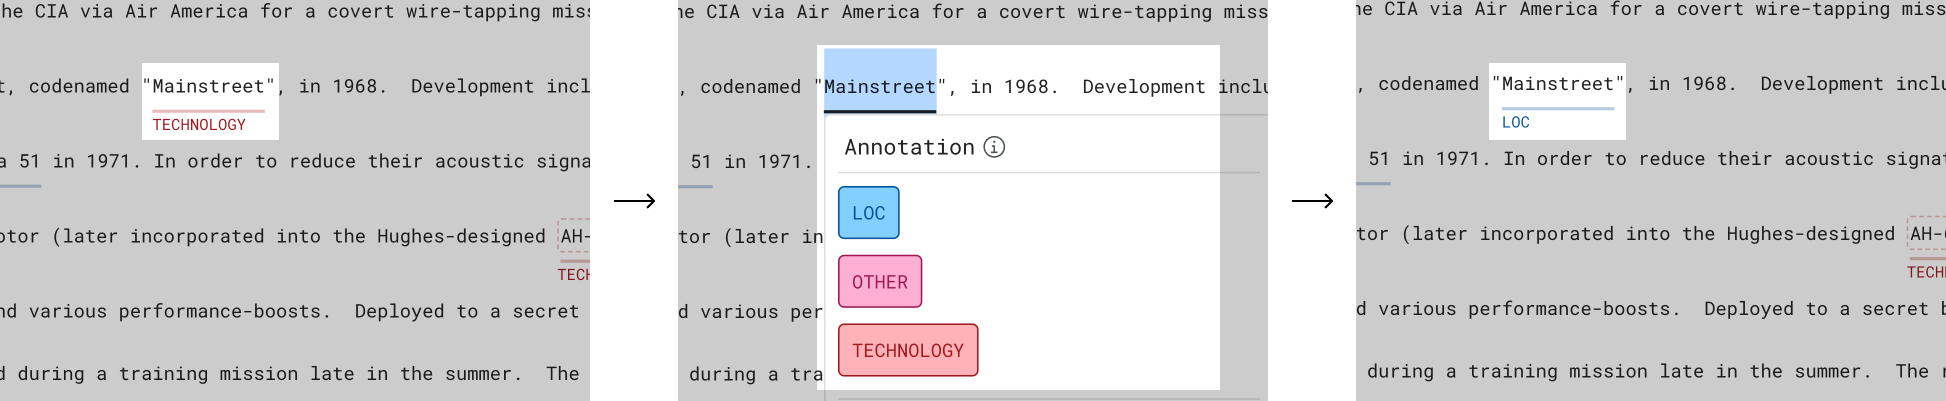
Use the cursor to highlight the desired span text, and then use the modal that appears to add or change the ground truth label for that span.
Remove all ground truth labels
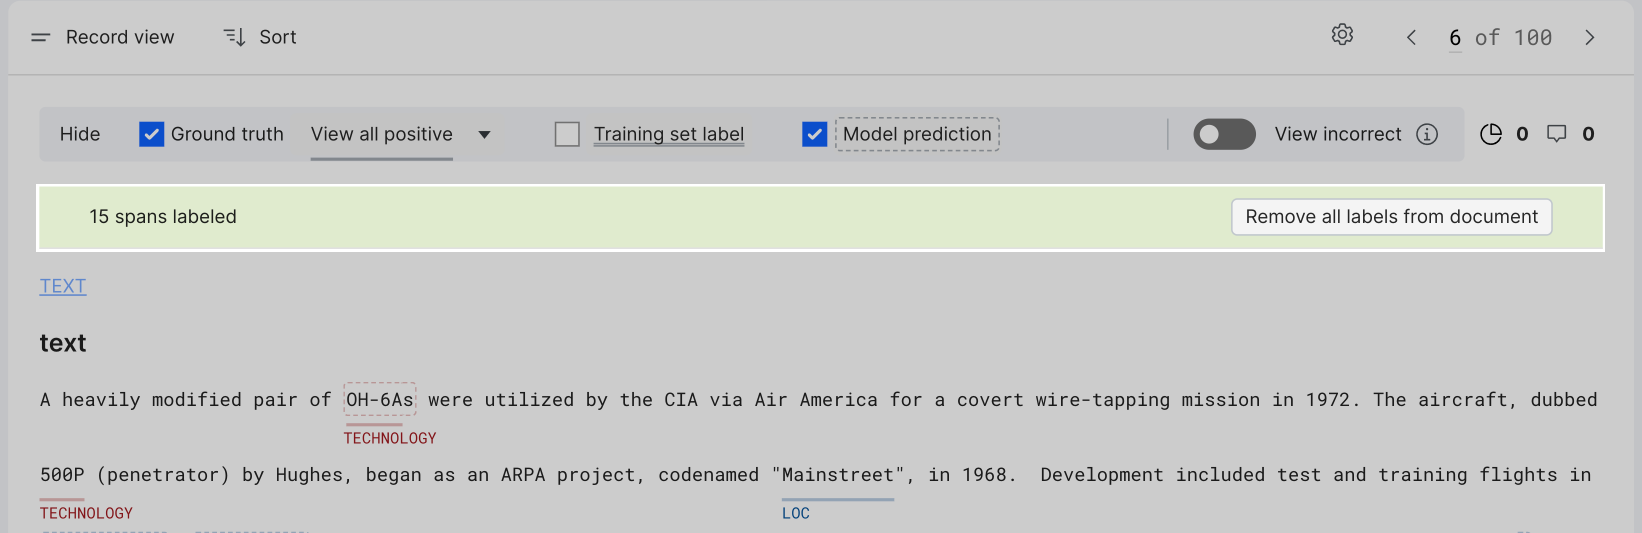
Click the Remove all labels from document button in the green bar below the highlight control row to remove all ground truth labels.
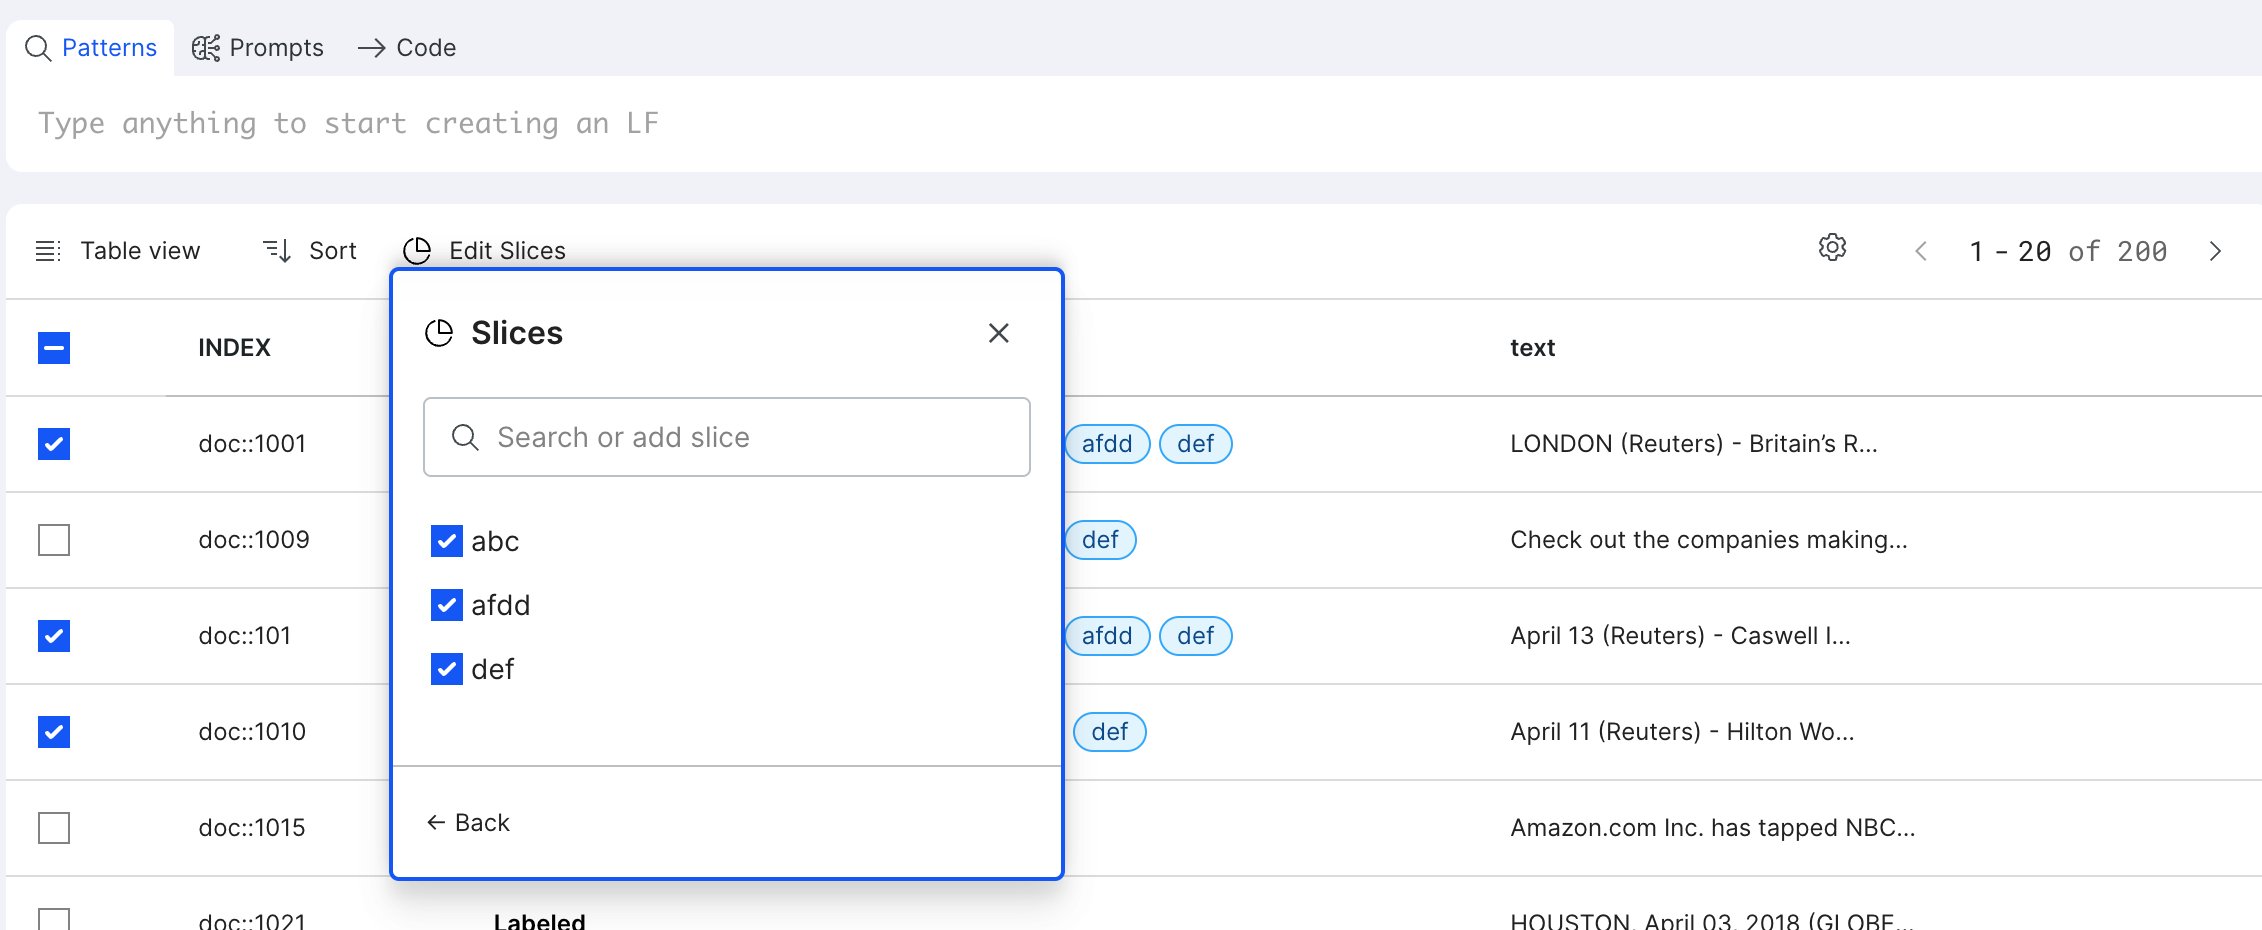
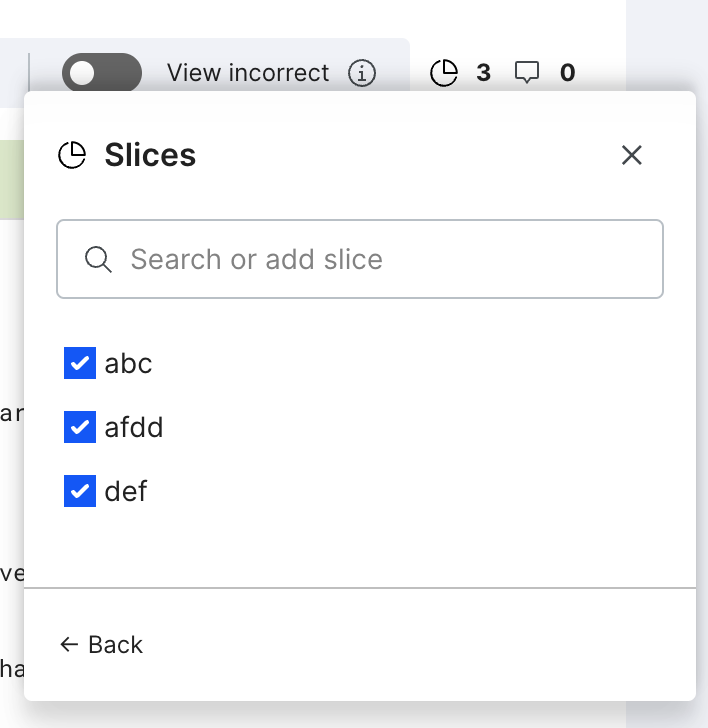
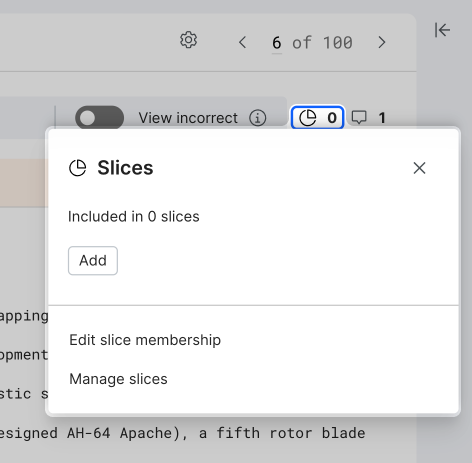
Add and manage slices
To categorize data for better discovery or error analysis, you can add or manage slices. Select the slice icon to open and select from a list of slices. To manage all slices, select Manage to open the management pane.
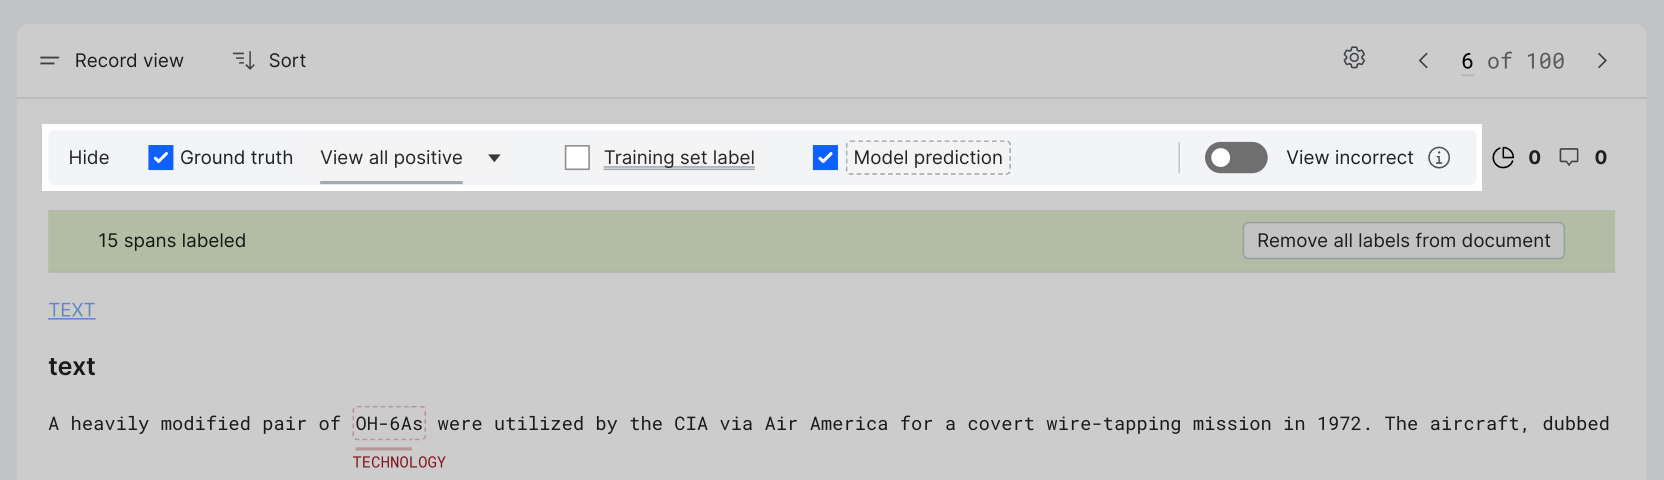
Find errors with spotlight mode
Spotlight mode focuses the record view on any instance where training set (TS) or model prediction (MP) disagree with the ground truth (GT). This mode does not filter the data.
Turn spotlight mode on and off from the highlight panel within the data viewer.
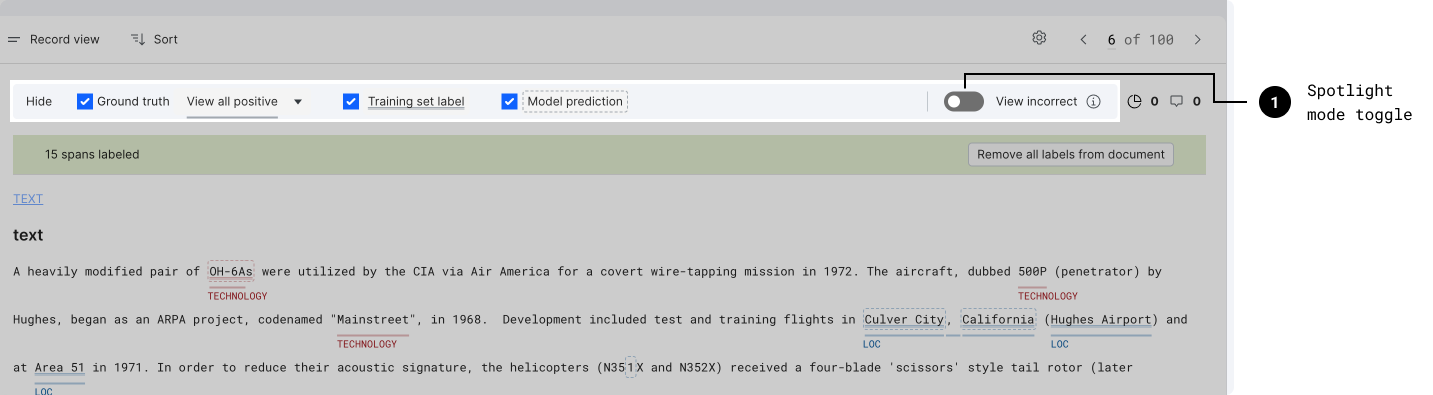
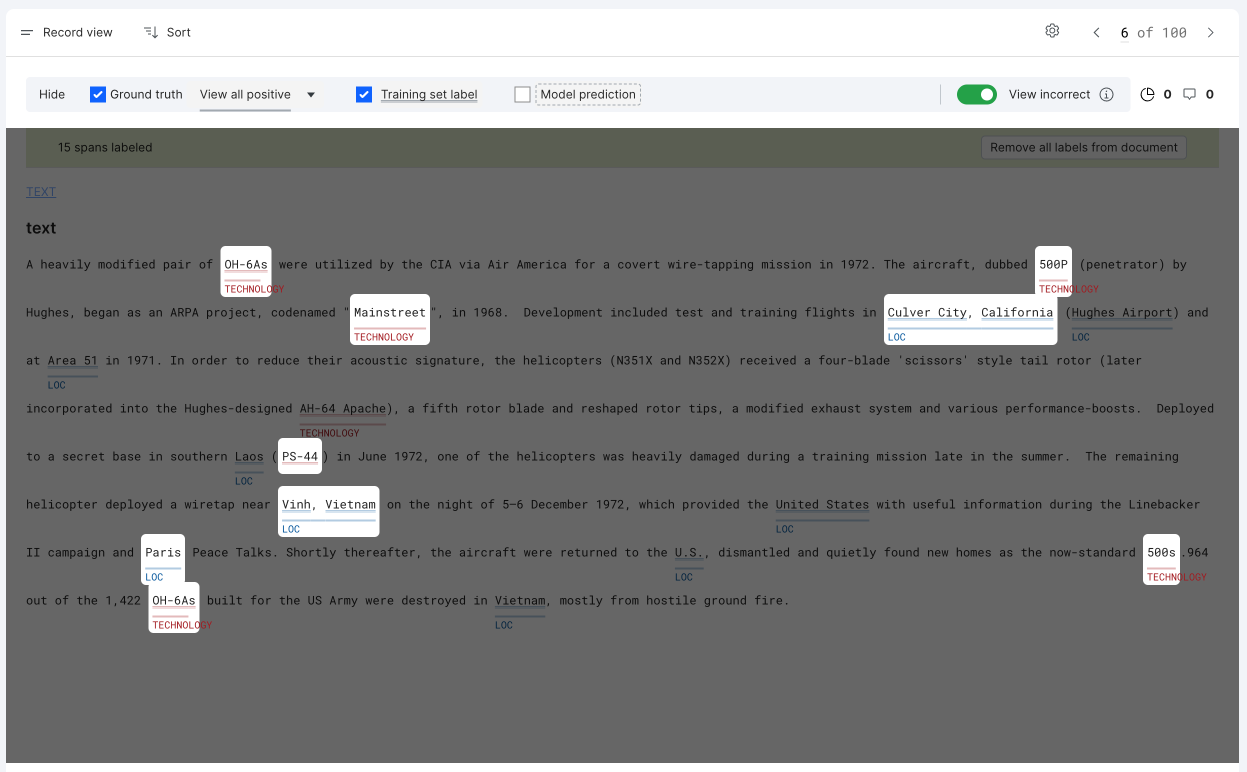
With spotlight mode toggled on, you can see where TS and MP disagree with GT.
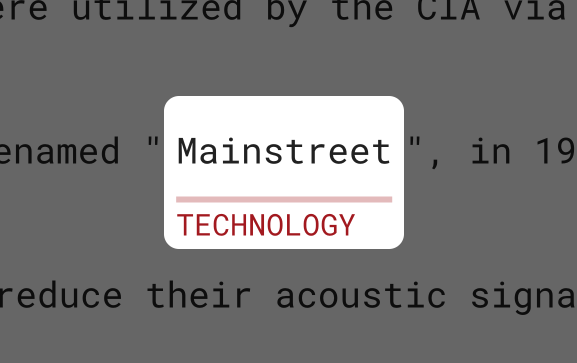
When you take a closer look at the first spotlight using the legend, you can see the GT is represented as a solid underline. The GT class of technology is colored red and has the accompanying label TECHNOLOGY. TS is represented as a double underline and MP as a dashed box.
The GT correctly labeled “OH-6A” as TECHNOLOGY. Both the TS and MP incorrectly labeled “OH-6As” as TECHNOLOGY, capturing an extra “s”.

In another example, “Mainstreet” is labeled as GT TECHNOLOGY. Both the TS and MP for technology missed it.
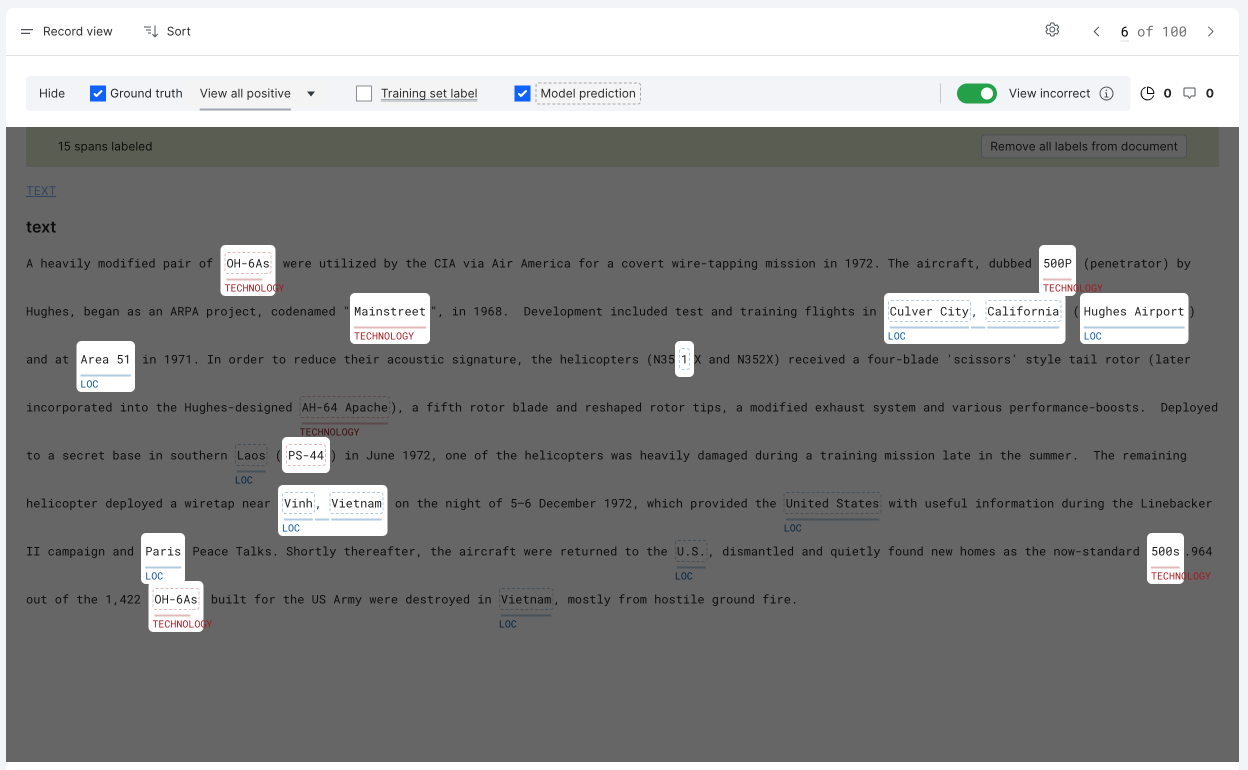
If you’d like to focus on only instances where TS conflicts with GT, then uncheck the box next to MP.
If you’d like to focus on only instances where MP conflicts with GT, then uncheck the box next to TS.
While spotlight mode doesn’t filter data, it does work with filters applied.
Add and manage slices
To categorize data for better discovery or error analysis, you can add or manage slices. Select the slice icon to open and select from a list of slices. To manage all slices, click Manage to open the management pane.
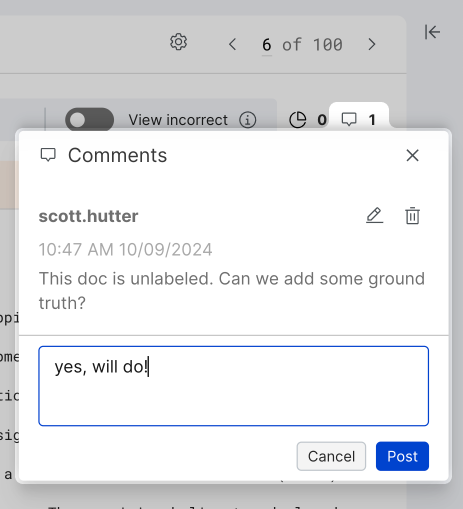
View and add comments
Click the speech bubble icon to view all existing comments and add your comment. To find existing comments, you can filter by comments using the data filter.
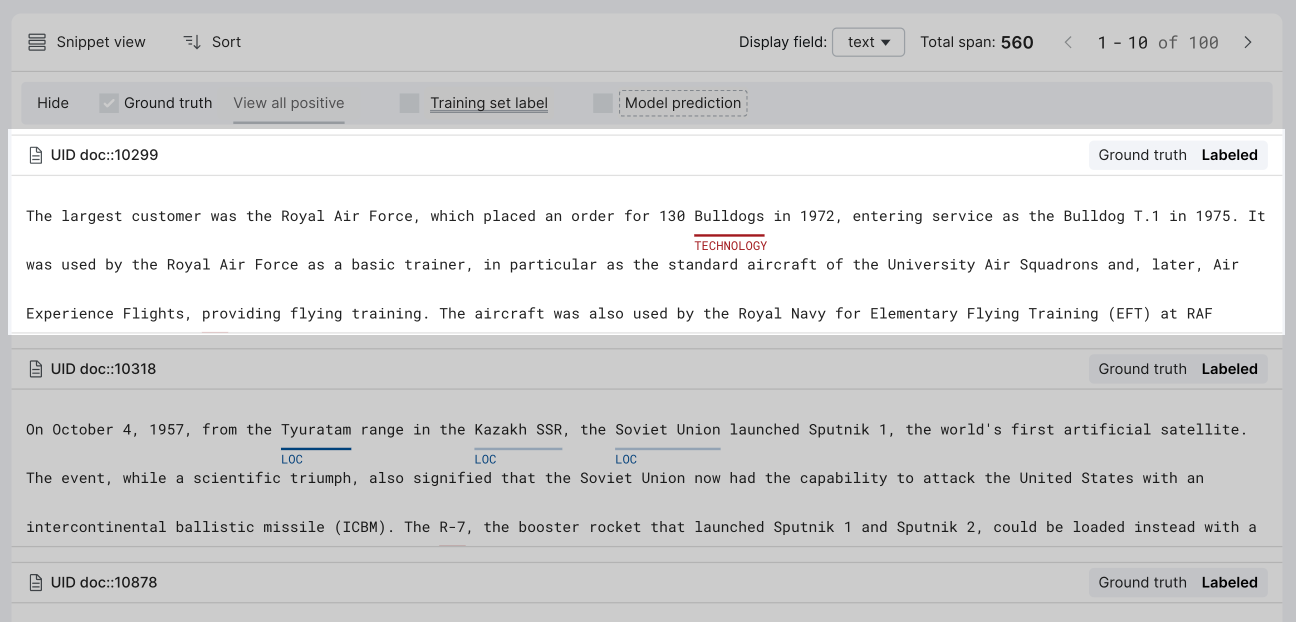
Snippet view
The Snippet view provides a "snippet", or a short piece of data content of multiple data points. It is useful to display search results or series of data points voted by a LF, where applicable matching strings are highlighted in the snippets. Use this view to:
- Quickly confirm string matches and its immediate context.
- View ground truth, LF votes, etc.
For sequence tagging applications, the Snippet view includes a highlight control pane.
The following actions are supported in Snippet view:
- Scrolling within snippets to display more spans within a document.
- Navigate to the Record view by clicking on a span.
- When editing or creating a LF, matching text patterns are highlighted in yellow.
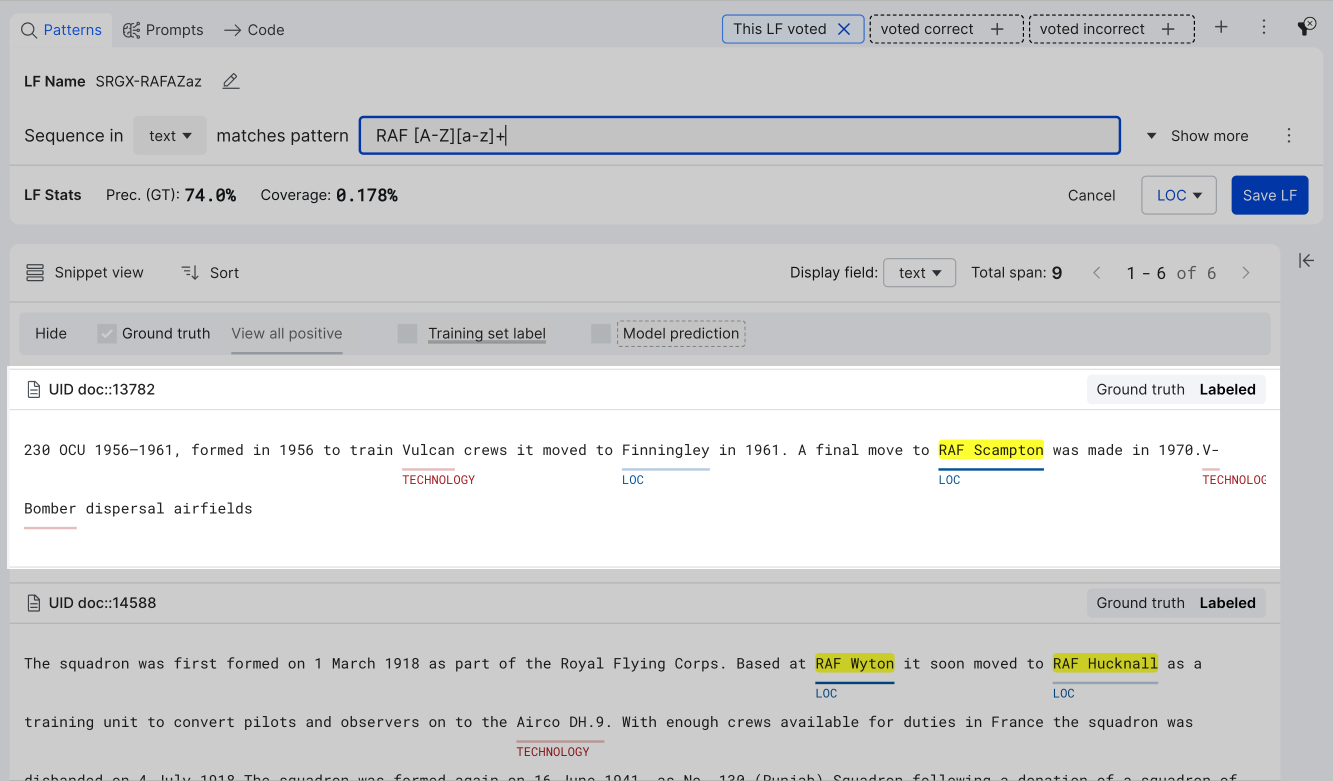
Table view
The Table view displays your data points in a tabular format, with each row representing a document. This view is most useful to perform bulk actions to edit slices.
The following actions are supported:
- Customize columns by using the advanced controls > click on Select displayed columns.
- Sort the data by clicking on column headers.
- Use the checkbox to select desired data points, then click Edit Slices to add, delete, or edit slices in bulk.