Data content views: Classification
This page walks through the various ways that you can view and interact with your data in dataviewer.
This page covers the views and options for classification applications. For other application types, see Data content views: Candidate-based or Data content views: Sequence tagging for more information.
The data content section is the main canvas to show case your data in individual or aggregated formats.
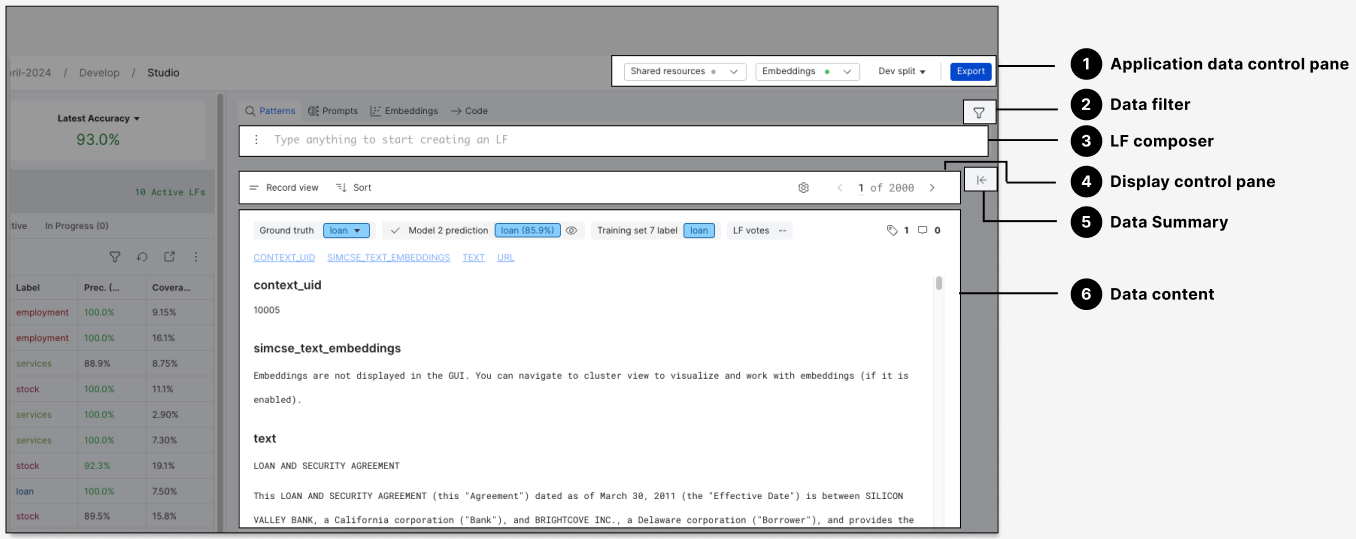
The following views are supported in classification applications:
Record view: View and edit metadata
Record view is the default view of data content in classification applications. For a singular data point, it displays key metadata as well as the full content of each field in a list format. Use this view to:
- View metadata (e.g., ground truth, model prediction, labeling function (LF) votes, and training set label)
- Edit metadata
- View data content
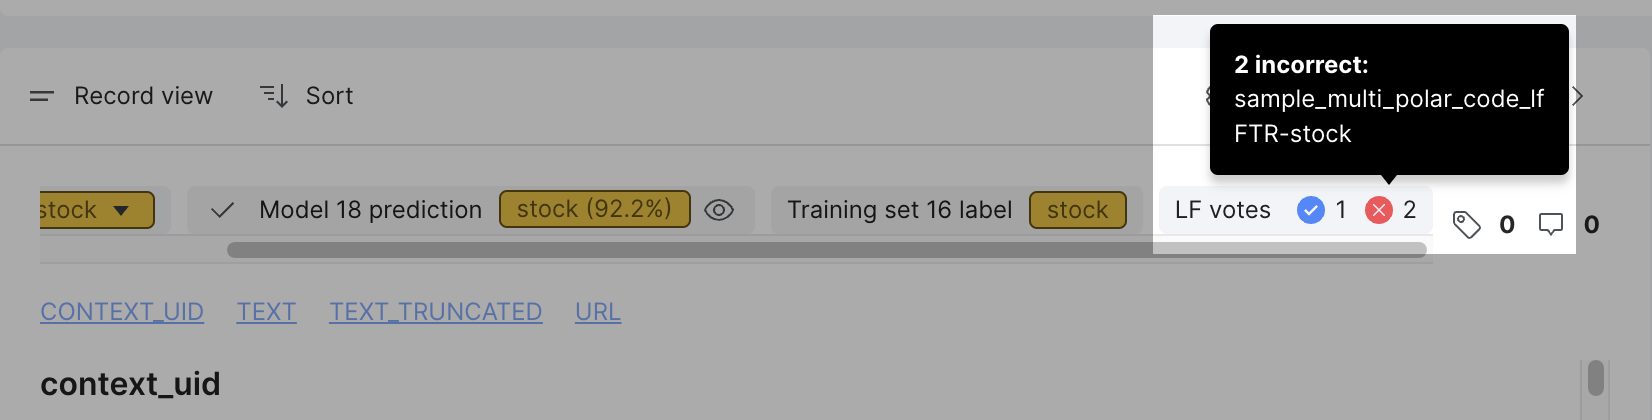
The Record view in classification applications includes a metadata row where ground truth, model prediction, LF votes, slices, and comments are shown. Below the metadata row, the data content is displayed in a list format, with an anchor row to quickly navigate to specific filed content.
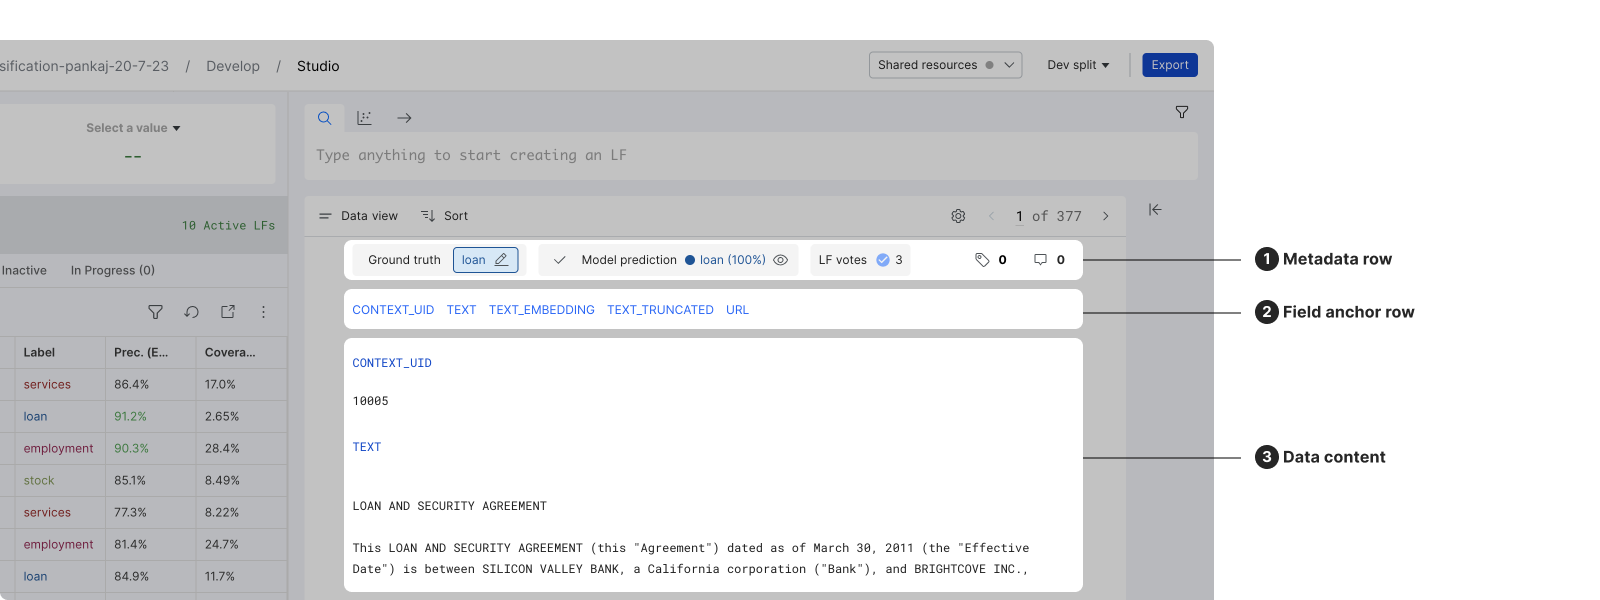
The following sections walk through the actions that you can take while in the Record view.
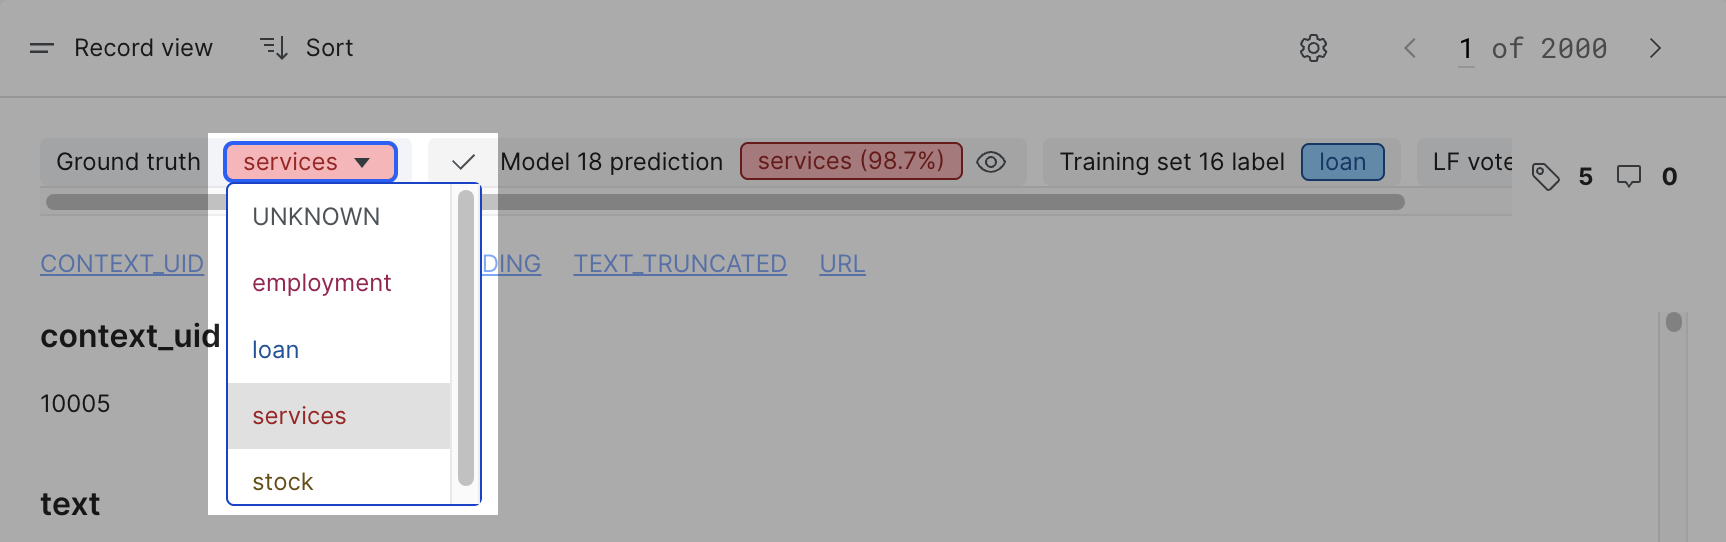
Change the ground truth of a document
In the Ground truth chip, click to open the dropdown list and change the ground truth of the document.
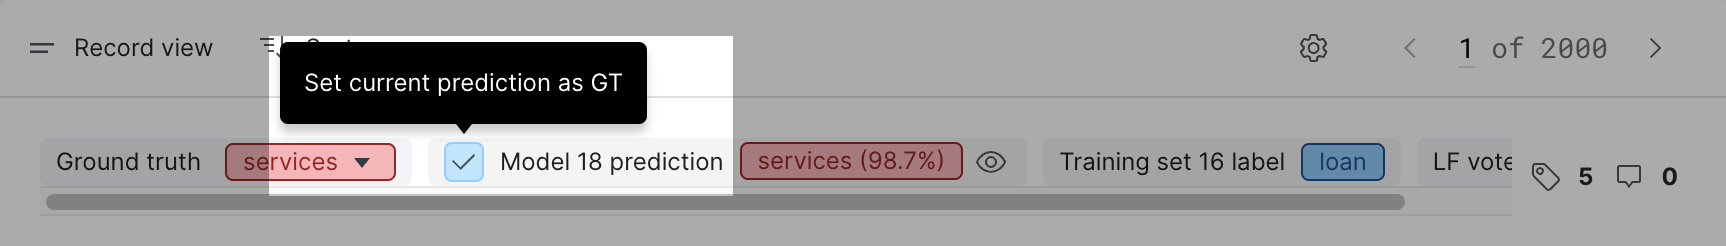
Apply model prediction as ground truth
Click the checkmark icon to overwrite the data point's ground truth with the current model prediction. This is helpful in the error analysis stage when errors are caused by incorrect ground truth while the model prediction is correct.
View LF votes details
In the LF votes chip, hover over the blue checkmark icon to see all LFs that voted correctly. Hover over the red X icon to see all LFs that voted incorrectly.
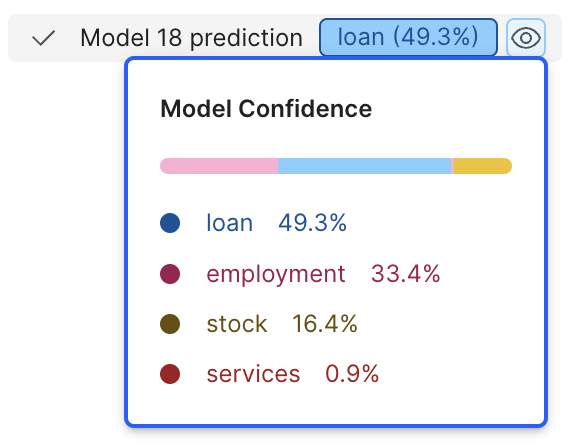
View the prediction distribution
Click the eyeball icon next to the Model prediction to view the Prediction distribution. The distribution represents the likelihood or probability associated with each class as predicted by the model.
If you train a model with Tune threshold on valid = True, the predicted label might not be the label with the highest probability. For this example, the tuned threshold is 70%. If the prediction probability for the positive label is 65% and the prediction probability for the negative label is 35%, the predicted label will be negative, even though it has a lower probability. This label is because the probability of the positive label is lower than the threshold.
View the training set label
In the Training set label chip, the training set label is displayed.

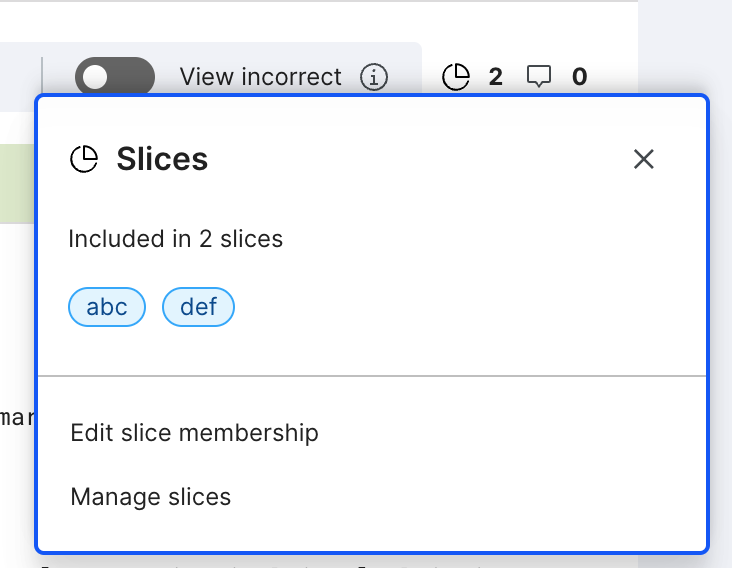
Add and manage slices
Click the slice icon to open and select from a list of slices. Slices are useful when you want to put data into specific categories to discover and perform error analysis. To manage all slices, click Manage to open the management pane.
View and add comments
Click the speech bubble icon to view all existing comments and add your comment. To find existing comments, you can filter by comments using the data filter.

Snippet view
The Snippet view provides a "snippet," or a short piece of data content of multiple data points. It is useful to display search results or a series of data points that were voted by a LF, where applicable matching strings are highlighted in the snippets. Use this view to:
- Quickly confirm a desired string match and its immediate context.
- View ground truth, LF votes, etc.
The following actions are supported in Snippet view:
- Ground truth (text) and LF votes (blue/red dots) are displayed at the document level. Each document is displayed once.
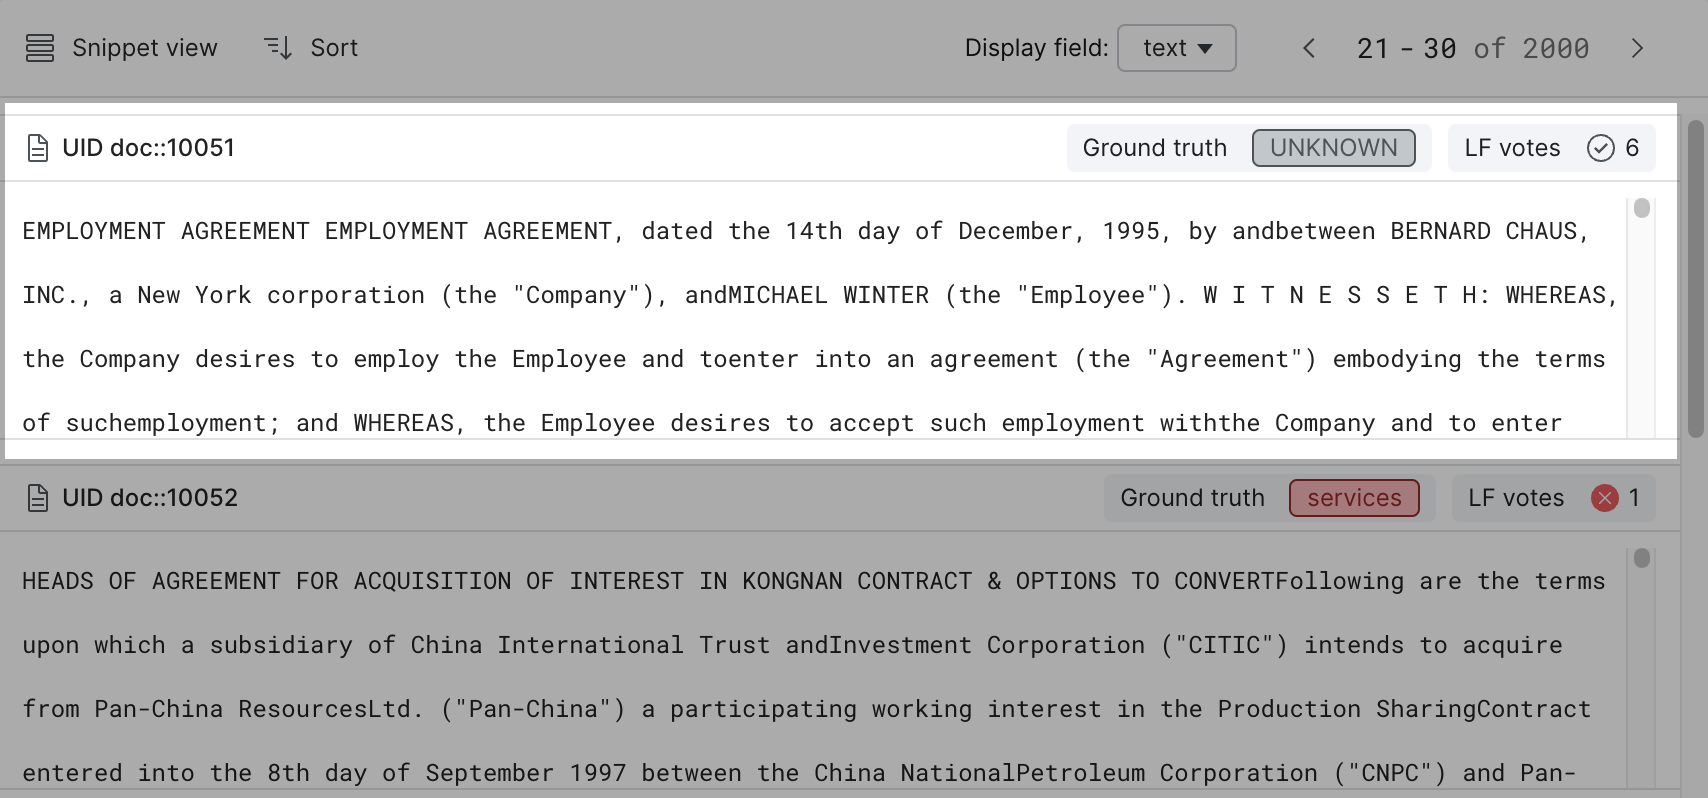
- To change the field that is displayed in Snippet view, use the Display field dropdown at the top right corner of the dataviewer.
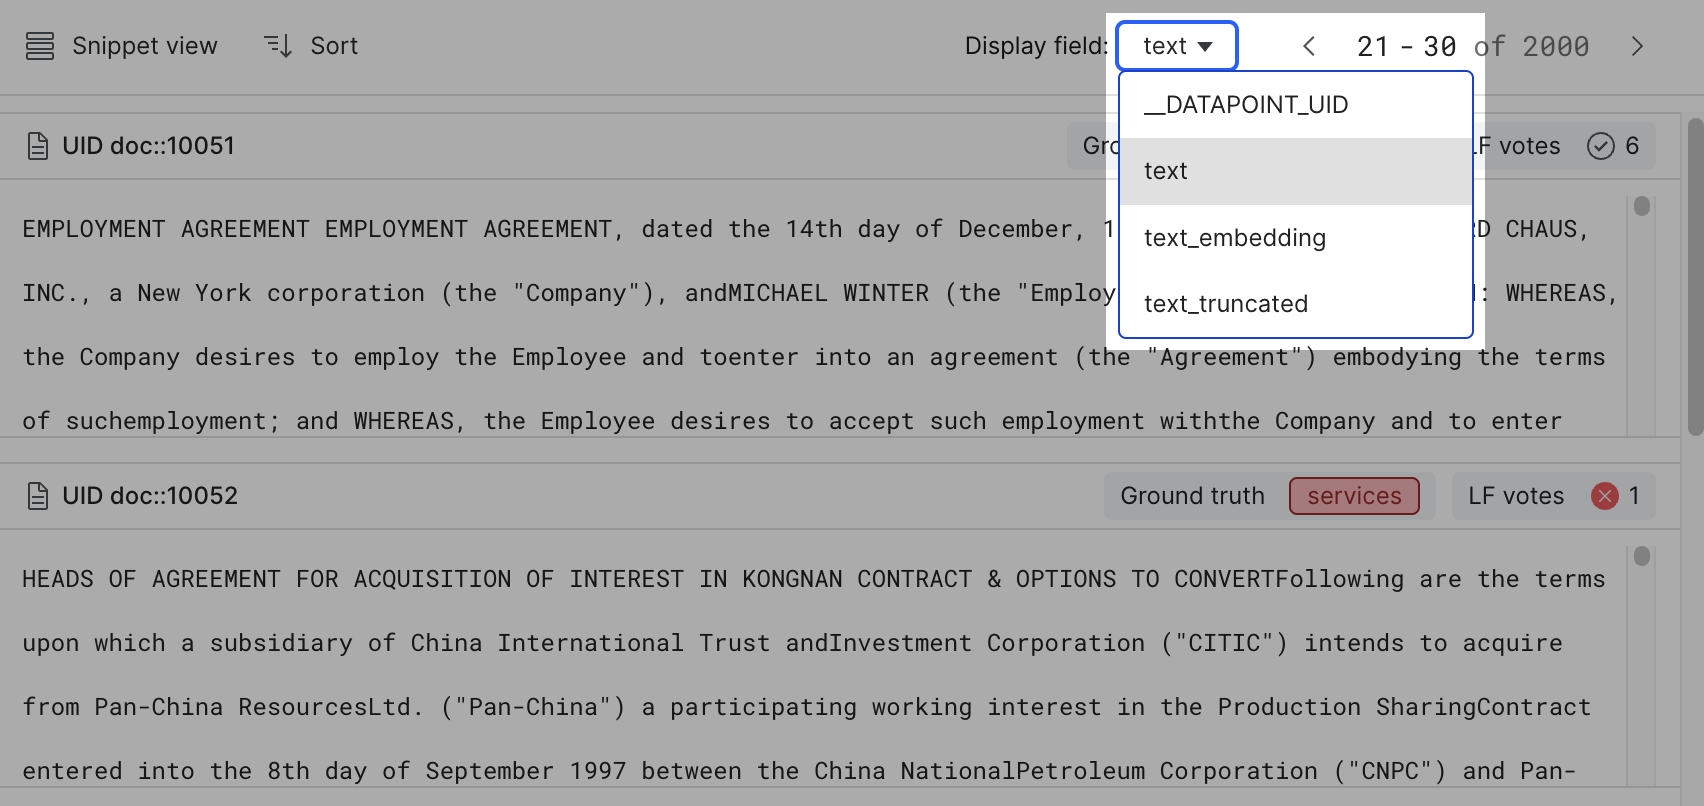
Table view
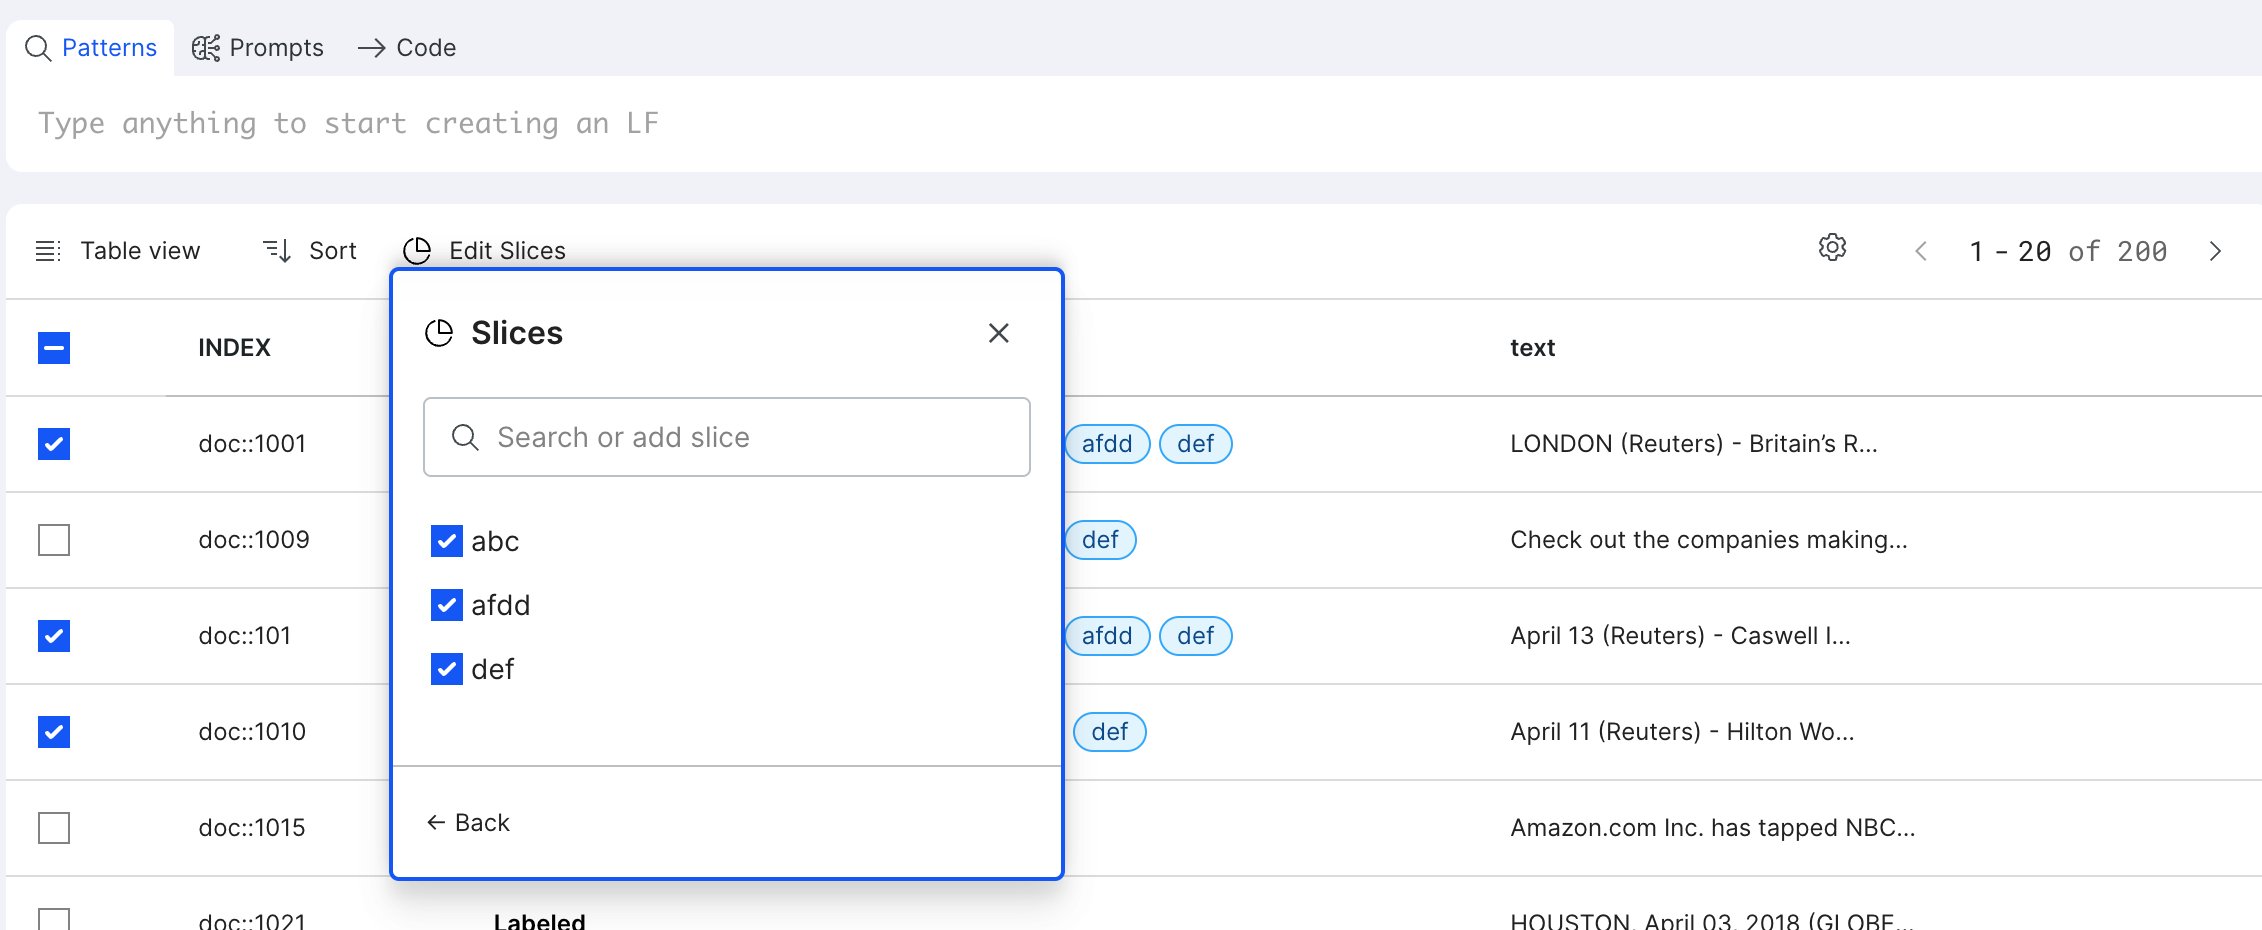
The Table view displays data points and their field values in a tabular format. Each row in the table represents a single data point. This view is most useful to perform bulk actions to edit slices.
The following actions are supported in Table view:
-
To change the fields that are shown in the table, in the advanced controls, click Select displayed columns.
-
To change the sort order, click the header.
-
Use the checkbox to select desired data points, then click Edit Slices to add, delete, or edit slices in bulk.