Run an initial evaluation benchmark
Once you've completed artifact onboarding, it's time to set the benchmark for this GenAI model.
Run the first evaluation to assess the model’s performance. The data, which are the reference prompts and responses from the current version of the model, are fed into the evaluation and you can see performance across your slices and criteria.
To follow along with an example of how to use Snorkel's evaluation framework, see the Evaluate GenAI output tutorial.
Evaluate overview
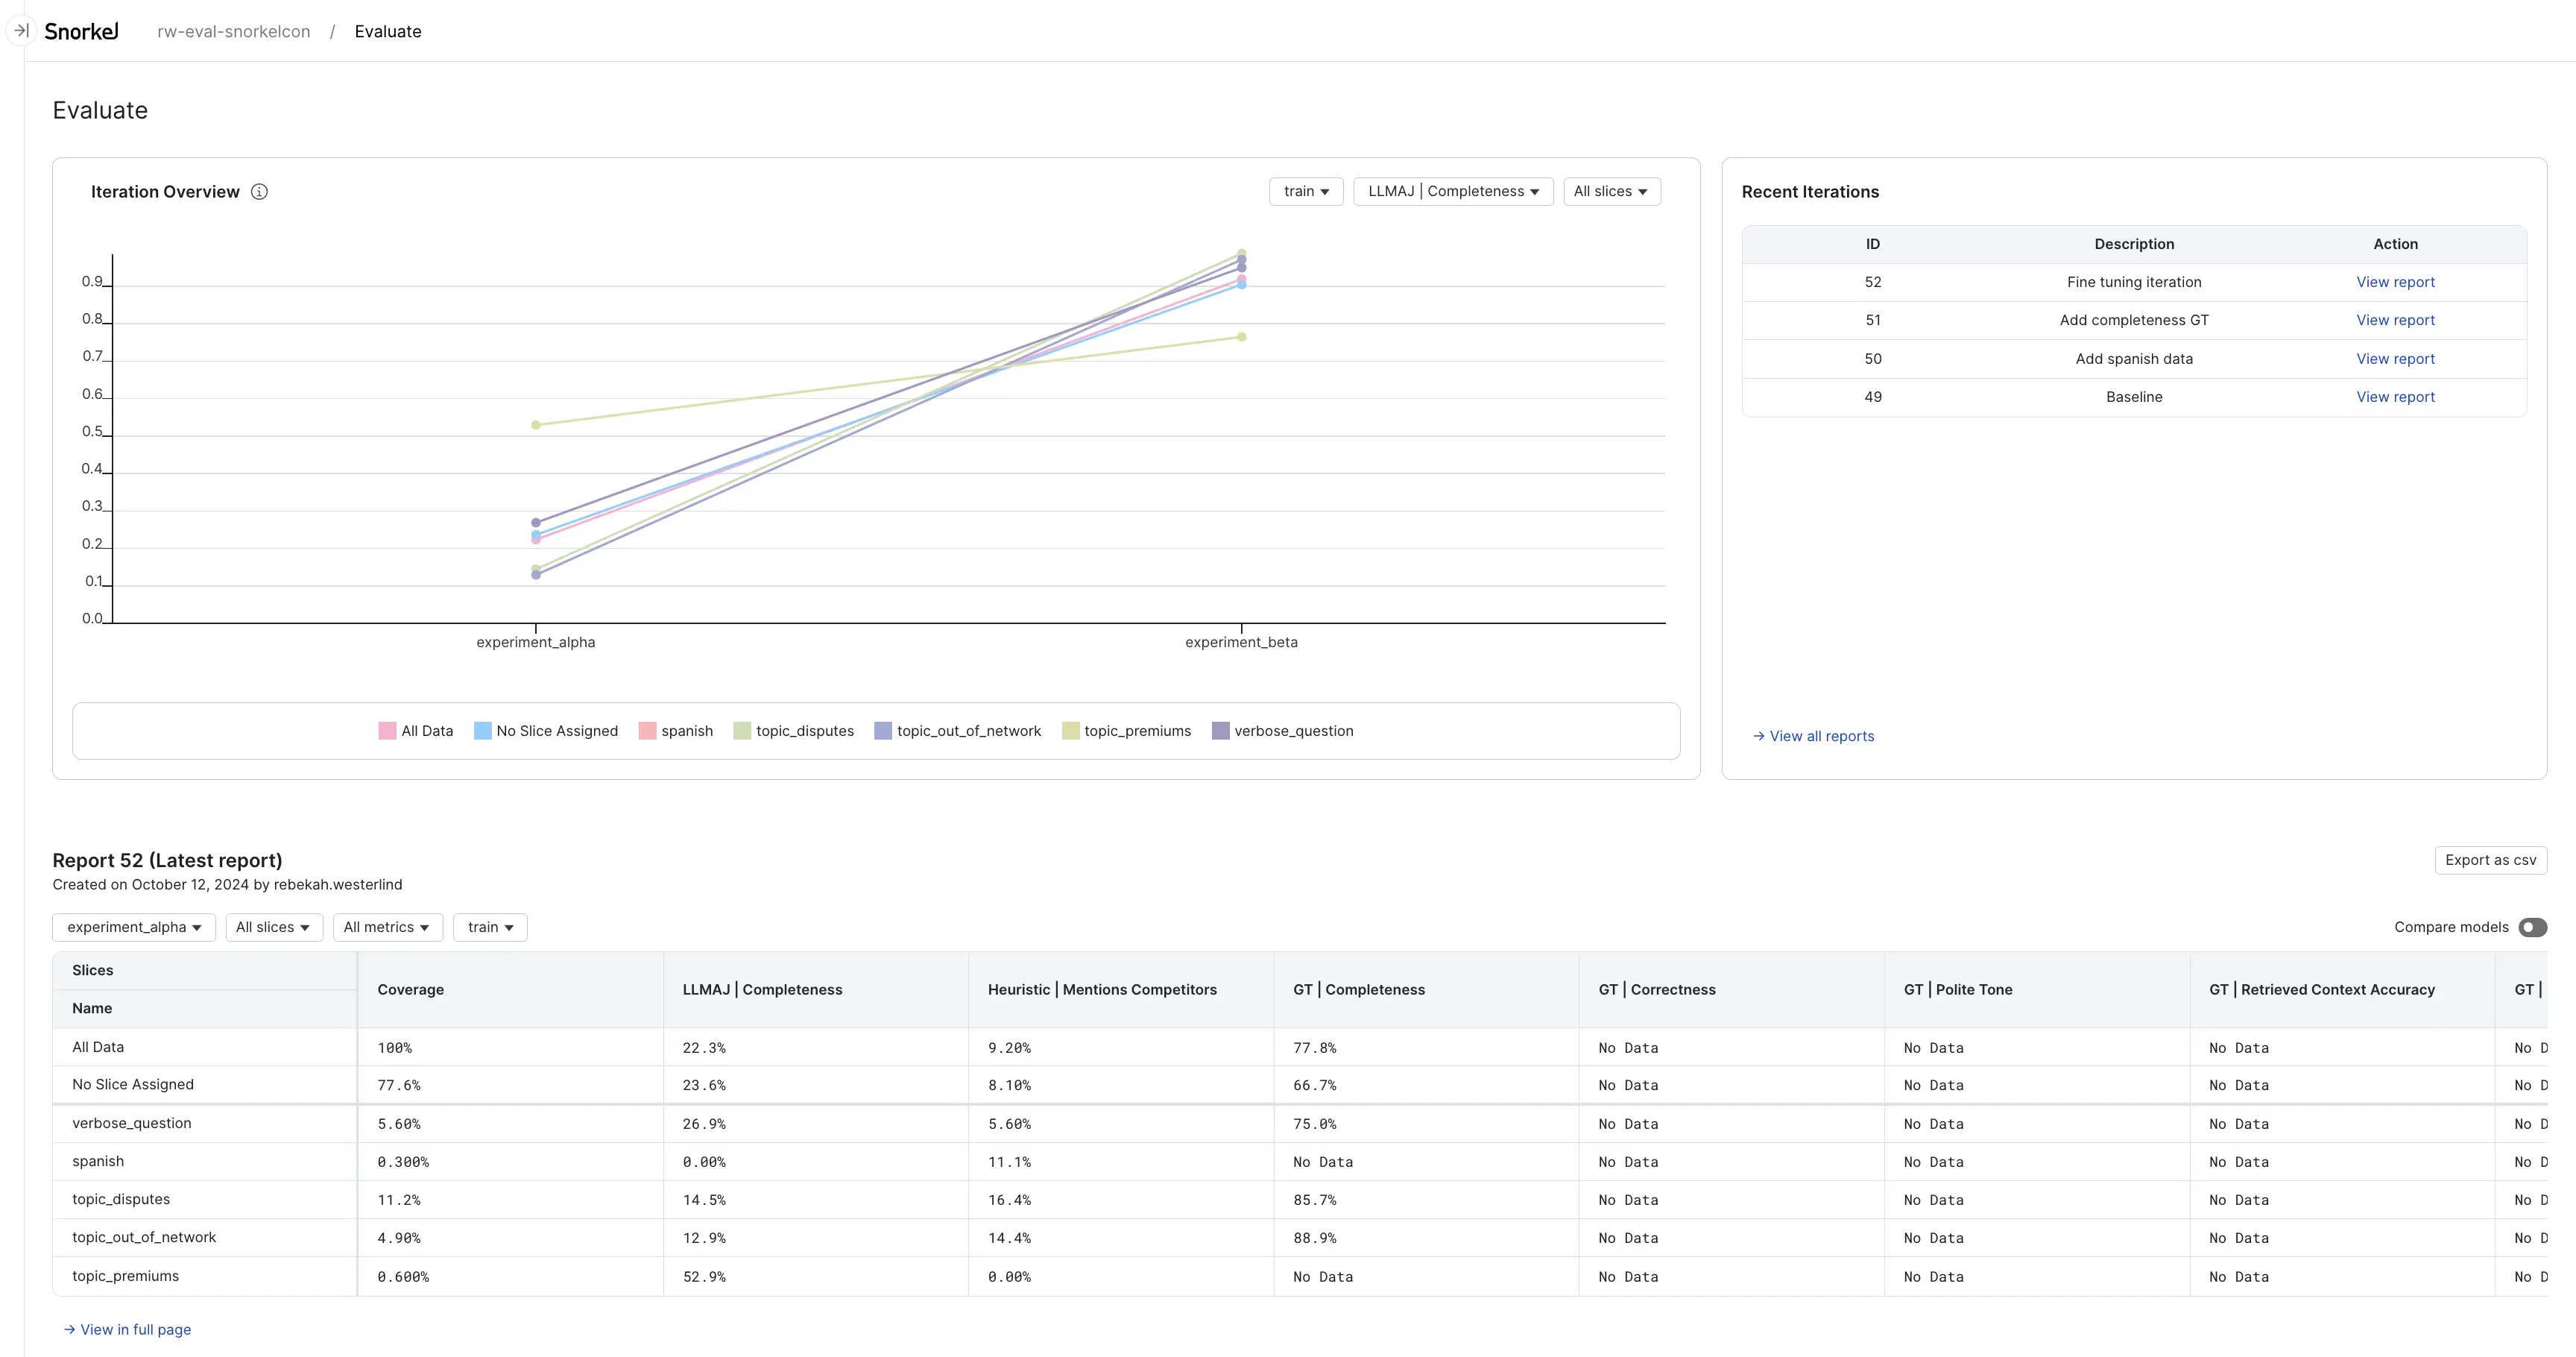
The Evaluate page has three areas:
- Iteration Overview, or performance plot
- Recent Iterations table
- Latest report data

Iteration overview
The iteration overview is a plot that shows how your performance has changed over recent iterations. Different data splits, evaluators, and slices can be selected so you can focus on what you care about. This is a helpful image to share with those interested in how your project is going. When you run the first evaluation, you will see points rather than lines in the plot. Once you have run multiple iterations, you will see lines connecting the points so you can visually track trends in performance.
Recent iterations table
The recent iterations table shows the ten most recent evaluation reports. It can be a useful way to see what steps you've taken recently to improve the performance of your model.
Latest report data
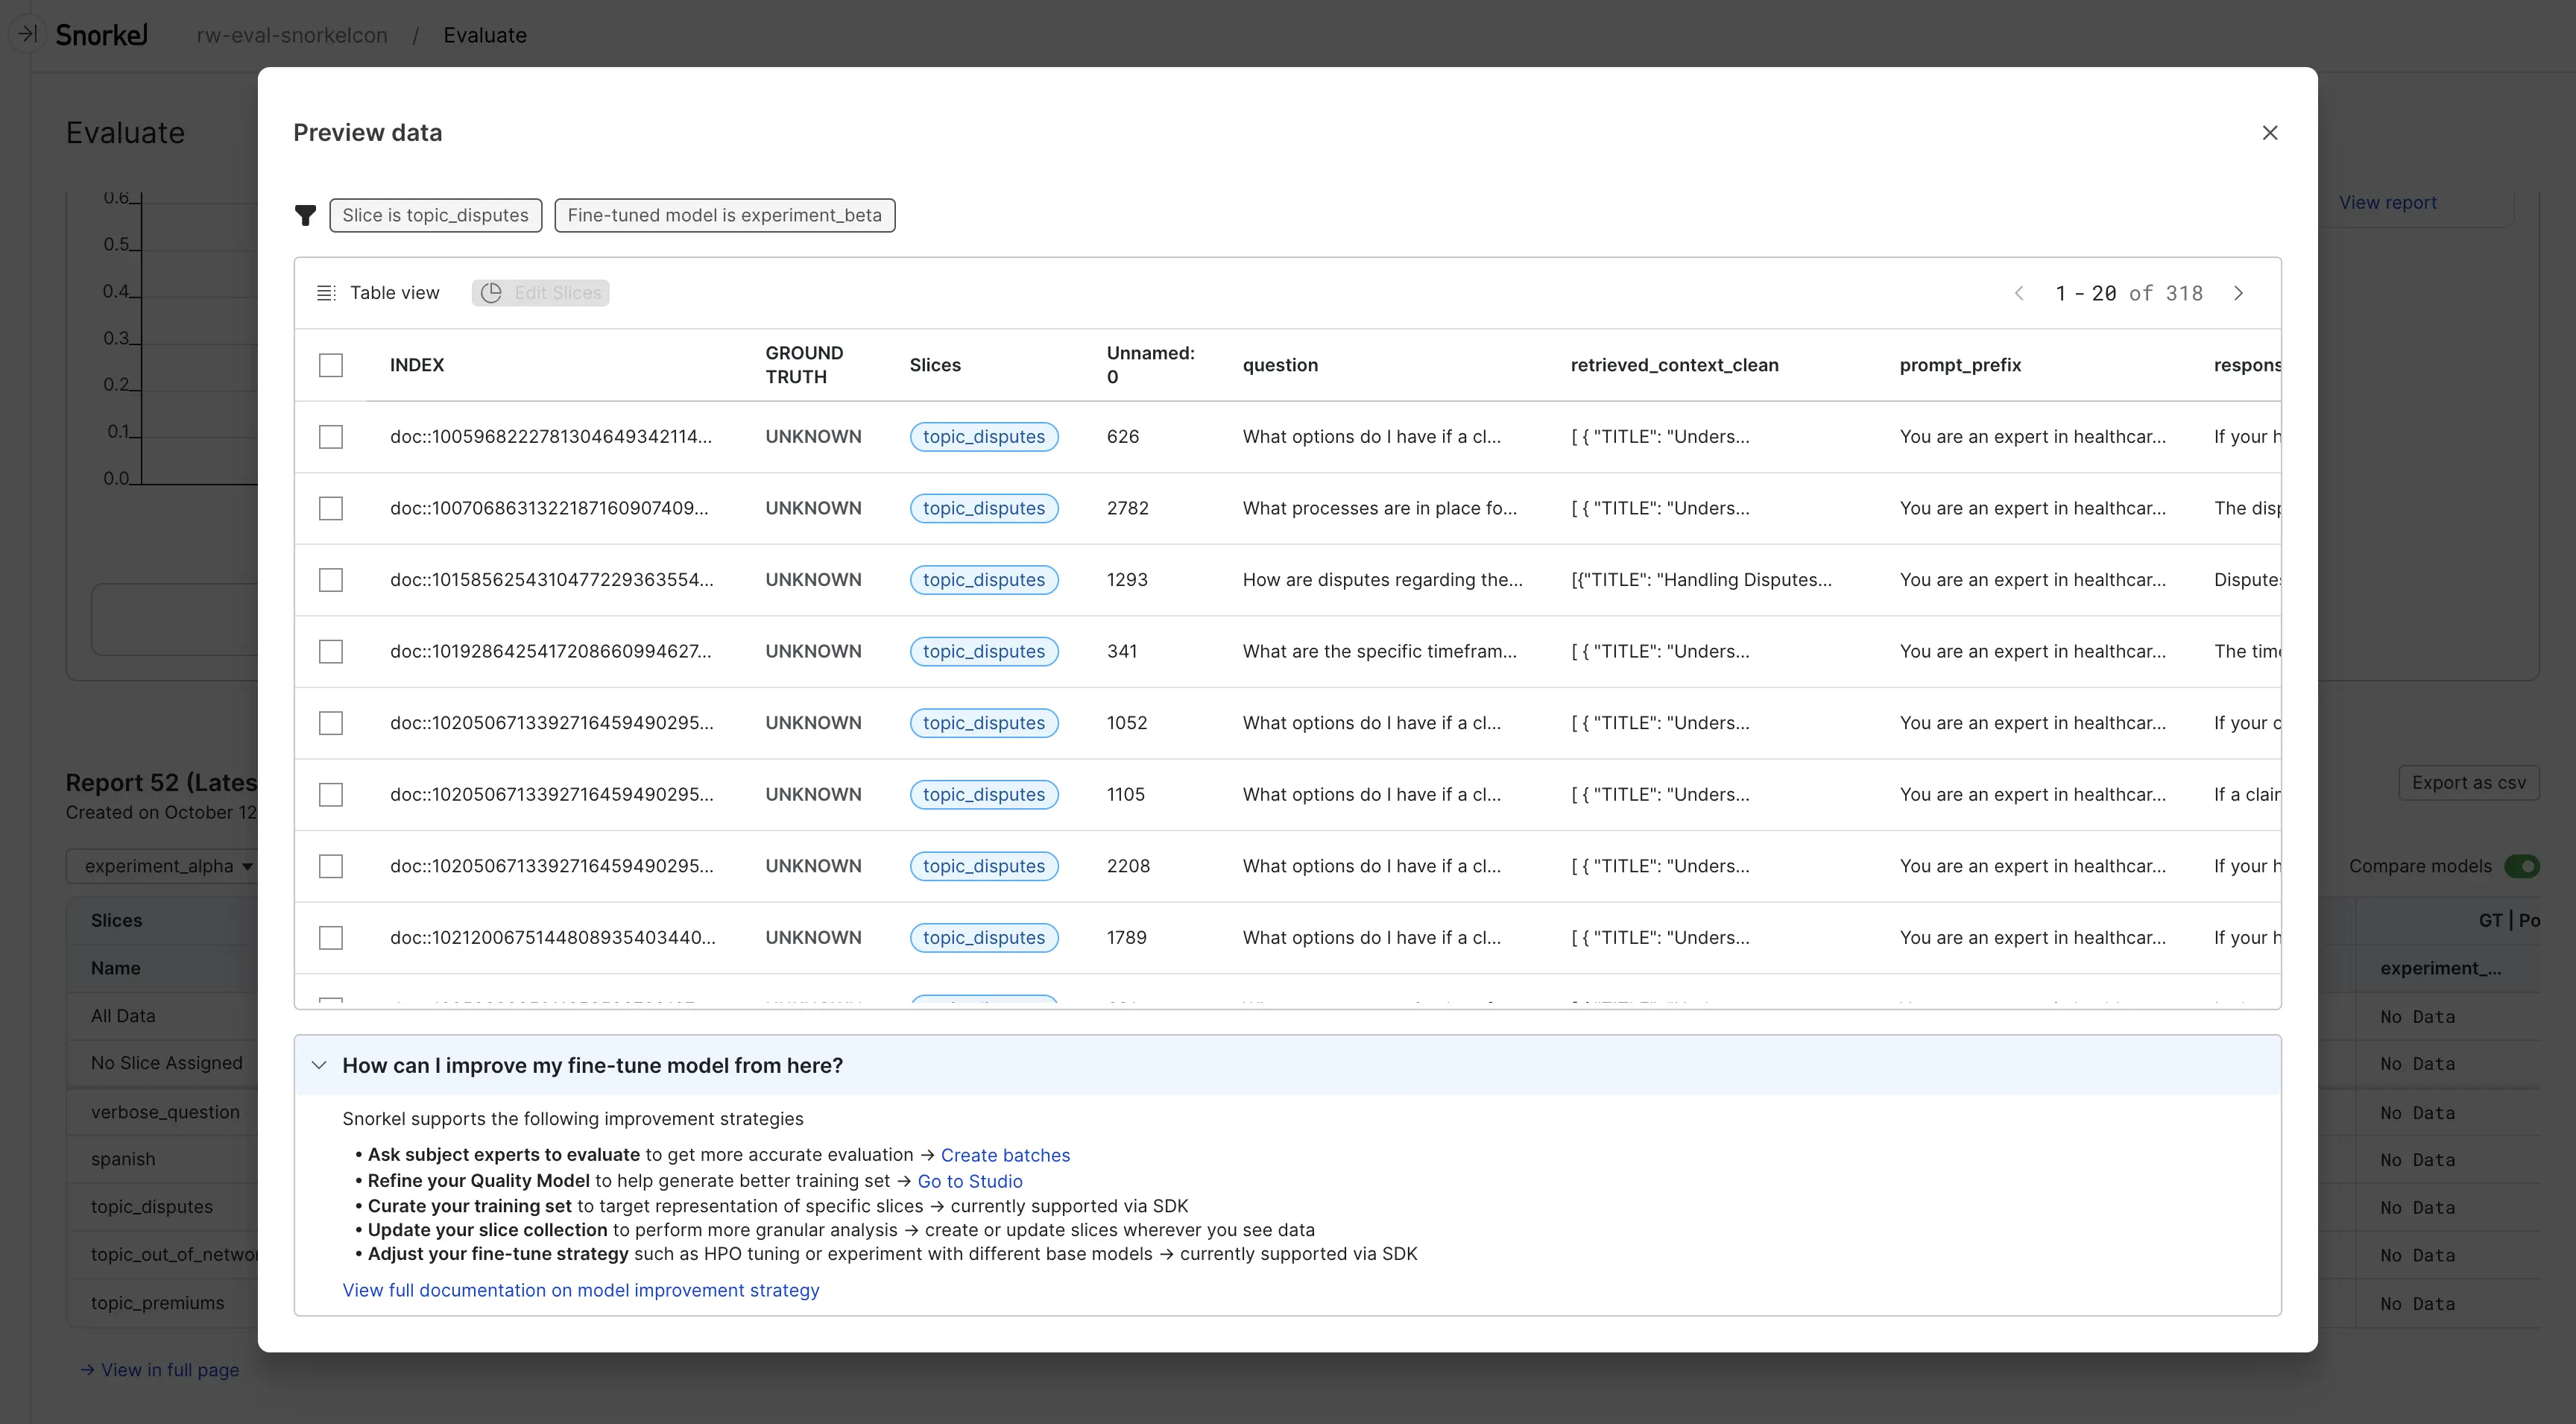
The latest report data is shown at the bottom of the page. It shows how each slice is performing for each evaluator. Select a cell in the data table to open a more detailed view of the data in that iteration and slice.

Next steps
Next, After running the initial evaluation, you may need to iteratively refine the benchmark. This step is iterative, with the end goal of having a benchmark that fully aligns with business objectives, so your measurements of the GenAI model's performance against it are meaningful.