Dataviewer overview
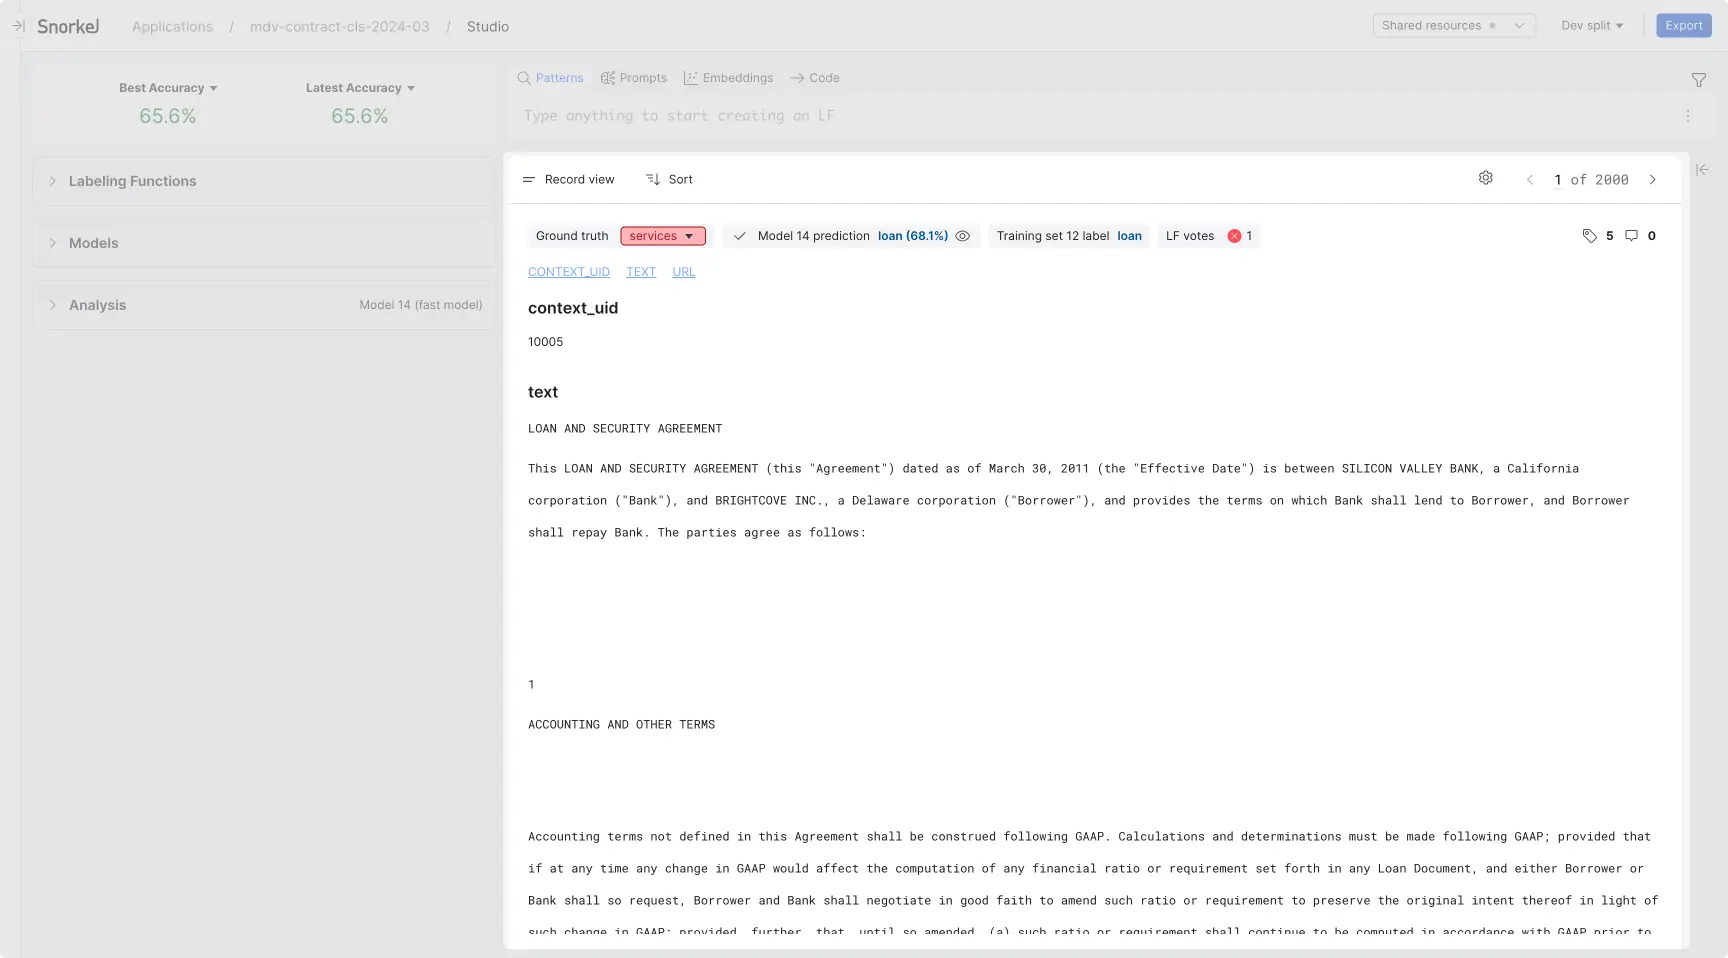
The dataviewer is the primary canvas for data exploration and supervision. You will use the dataviewer throughout Snorkel Flow, from verifying your uploaded data to annotating it with labels and developing models. Use the dataviewer to:
- View your data in different formats, individual and aggregate.
- Filter and sort your data.
- Compare metadata, including ground truths, model predictions, LF votes, and more.
- Edit ground truths.
- Slice and comment on your data.
Access the dataviewer
Because data is so central to everything you will do in SnorkelFlow, the dataviewer is available in several places throughout your application. Some of these places include:
- On the right hand side of your screen when you are creating an application after you have uploaded your dataset. This is outlined in the Create Application section.
- On the right hand side of your screen in the Application Studio after creating an application. This is located below the search bar for creating labeling functions (LFs) and shown in the screenshot below.
- In the center of your screen when annotating documents.
Dataviewer feature reference
Different features will be available in each place the dataviewer is seen and based on the application type, but there is significant commonality between them. These features are outlined below.

Keyboard shortcuts
Note: The below shortcuts are configured for the Development Studio. Some keyboard shortcuts on dataset-level annotation views are not supported.
Record view
| Shortcut | Description |
|---|---|
Right Arrow (→) | Navigate to next data point |
Left Arrow (←) | Navigate to previous data point |
Up Arrow (↑) | Navigate to previous candidate, only available in extraction tasks |
Down Arrow (↓) | Navigate to next candidate, only available in extraction tasks |
Document view
| Shortcut | Description |
|---|---|
Right Arrow (→) | Navigate to next data point |
Left Arrow (←) | Navigate to previous data point |
Up Arrow (↑) | Navigate to previous candidate |
Down Arrow (↓) | Navigate to next candidate |
Snippet view
| Shortcut | Description |
|---|---|
Right Arrow (→) | Navigate to next page of data |
Left Arrow (←) | Navigate to previous page of data |
Table view
| Shortcut | Description |
|---|---|
Right Arrow (→) | Navigate to next page of data |
Left Arrow (←) | Navigate to previous page of data |
Next steps
Explore the features and functionality of the dataviewer in the following sections:
- Filter data: Learn how to apply filters to your dataset
- Display control pane: Learn how to switch between different data views, sort your data, change which columns are displayed, navigate through your dataset, and use other advanced controls.
- Data summary pane: Learn about the right hand side panel in Application Studio that can show you aggregate statistics for your dataset.
- Data content views: Classification applications: Learn about features that are specific to classification applications.
- Data content views: Candidate-based extraction applications: Learn about features that are specific to candidate-extraction applications.
- Data content views: Sequence tagging applications Learn about features that are specific to sequence tagging applications.