Adding a Data Table Viewer
The TableConverter operator is a powerful tool in Snorkel Studio that allows you to represent complex, nested data in an easily readable table view. If your dataset includes columns with nested data (like arrays of dictionaries), the TableConverter helps you "flatten" this data into a more accessible format. This is especially useful for fields like user interactions, product attributes, or any data that naturally groups multiple related items.
Configuring the TableConverter Operator
-
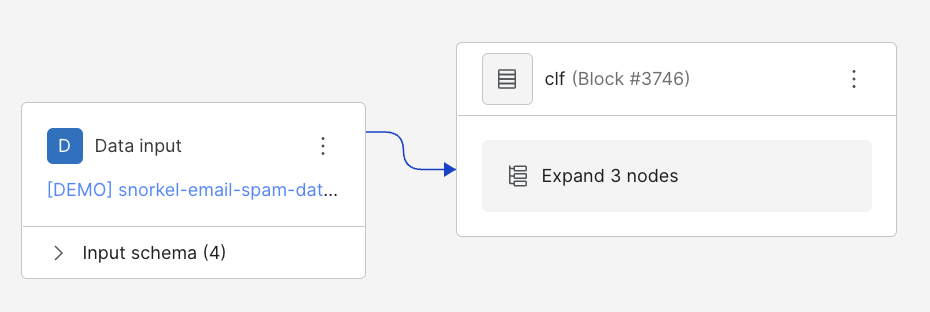
Navigate to the Application Studio and expand the desired node.
-
Ensure you are in Edit mode (use the mode selector in the top right corner of the Application Studio).
-
Add a new node by selecting the three vertical dots on the node labeled Model, and then select Add node before.
-
When prompted, select
ChangeColumns.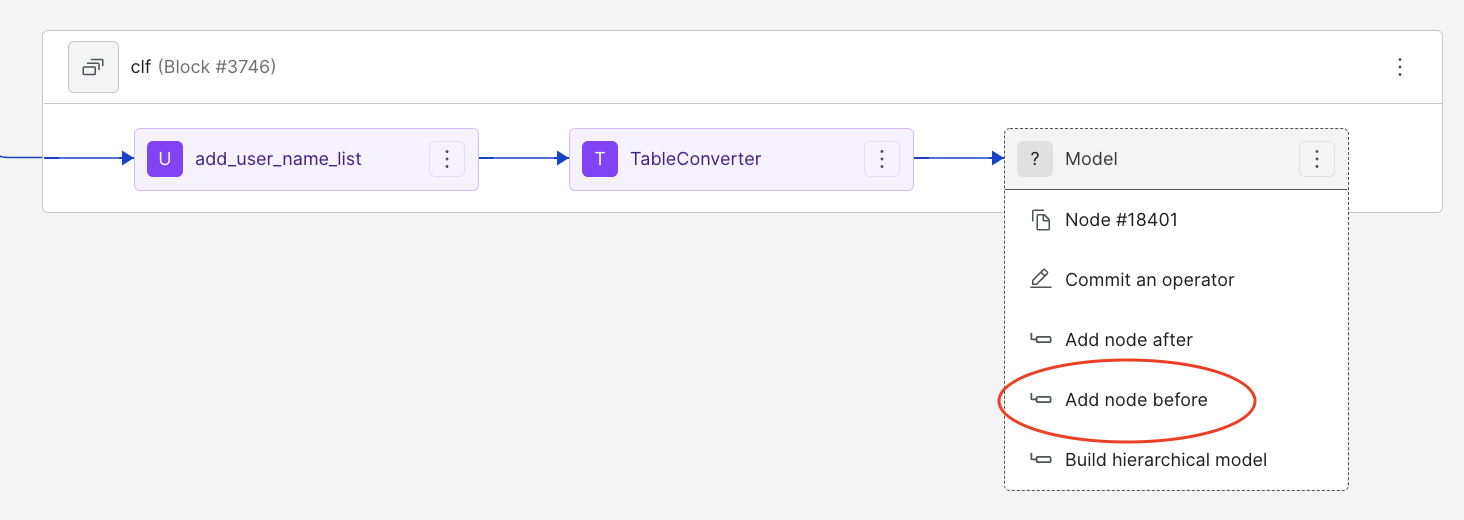
-
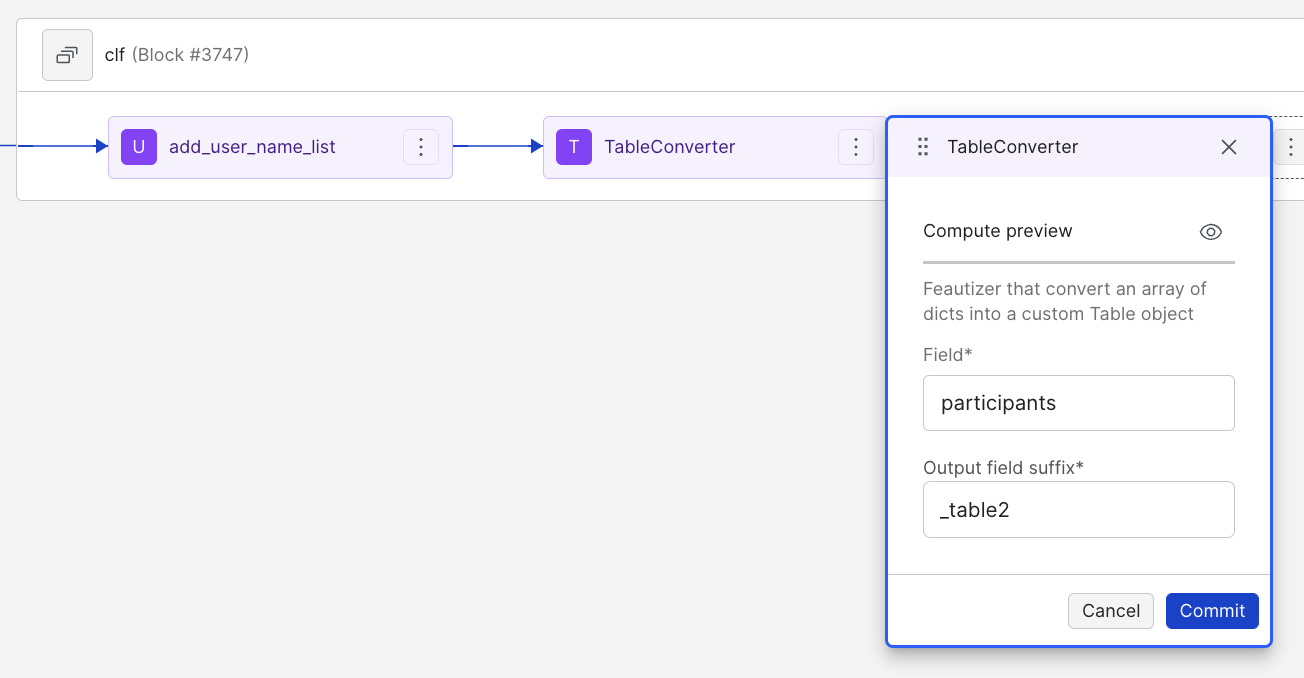
Commit the
TableConverteroperator to the node:- Open the node's menu (three dots) and select "commit an operator".
- Search for and select "TableConverter".
-
Configure the
TableConverterfields:- Select the column containing the array of dictionaries.
- Specify an output suffix to name the new table column.
-
Commit the changes and refresh the model node if prompted.
Displaying the Table View
-
Return to the Application Studio.
-
Open the data viewer settings (gear icon).
-
Click "Select displayed columns" and ensure the new table column is checked.
-
Scroll the data viewer to find your newly generated table.
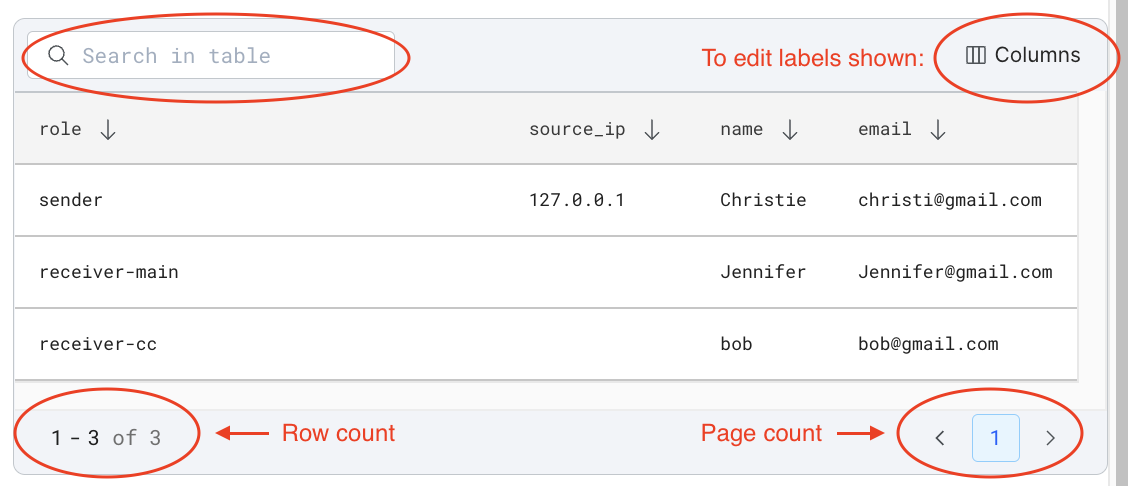
Using the Data Table Viewer
The table view offers several features to enhance data exploration:
- Column Selection: Use the column button in the top right corner to customize displayed columns.
- Pagination: Navigate through data pages using arrows in the bottom right corner.
- Search: Use the top-left search bar to filter data based on any visible label.
- Row Count: View the total number of rows in the bottom right corner.
- Sorting: Click on column headers to sort data. Use arrows to toggle ascending/descending order.
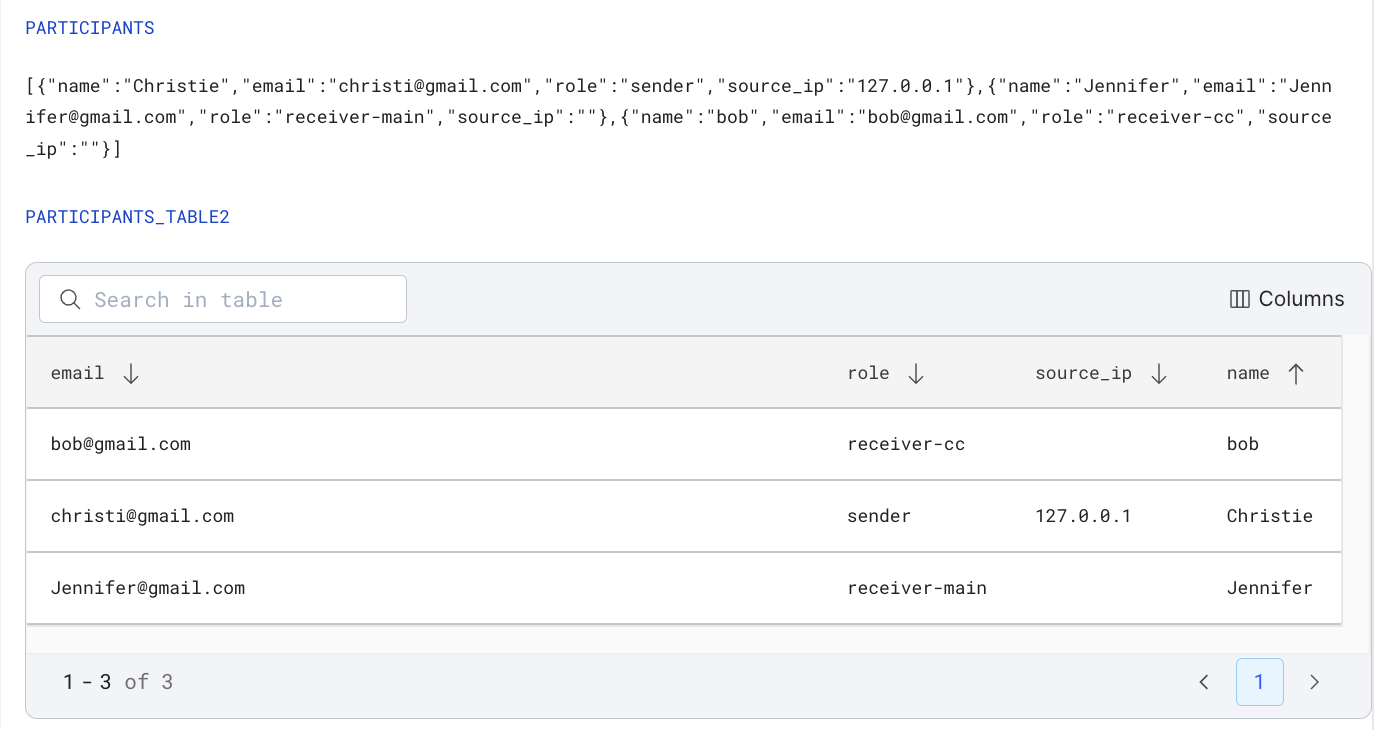
Example Use Case
In this documentation, we use an email classification dataset (HAM vs. SPAM) with a participants field to demonstrate the TableConverter. Your specific use case may vary depending on your dataset structure.
Tips for Effective Use
- Ensure your target column contains an array of dictionaries before applying the
TableConverter. - Choose a meaningful output suffix to easily identify your new table column.
- Experiment with different column combinations in the table view to gain insights into your data.