Adding a data table viewer
The TableConverter Operator allows you to represent lists of elements in a table view in the label section of the Snorkel Studio.
To produce the table view with a TableConverter operator
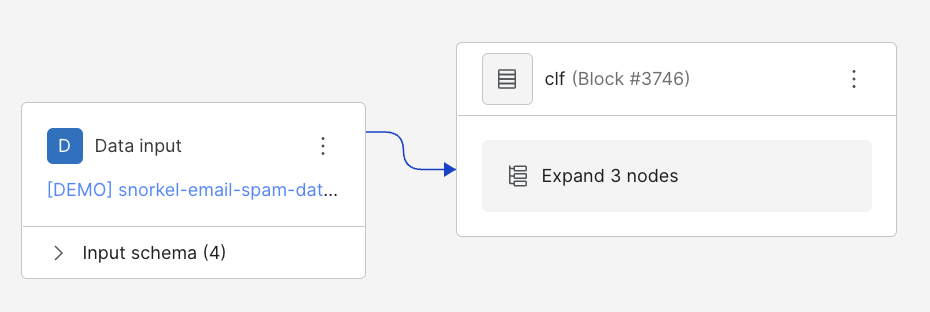
- Go to the Application Studio, and expand node.
- Before trying to add or delete nodes, ensure you are on edit mode in the application studio and not read mode. To switch modes, use the mode selector in the top right corner of the Application Studio.
- If you don’t already have a blank node, select the three vertical dots on the node labeled Model, and then select Add node before. When prompted, select
ChangeColumns.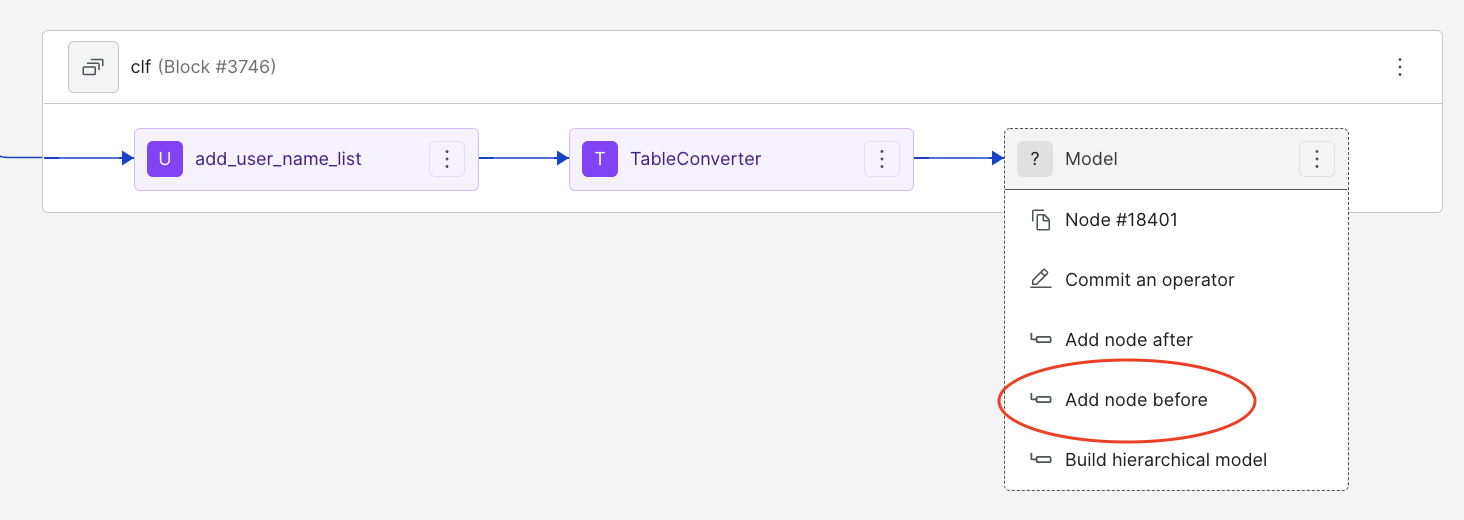
- Select the three dot menu on the new node labeled
ChangeColumnsand selectcommit an operator. - Type “TableConverter” in the menu search bar, and select the option.
- Fill out the fields of the
TableConverterwith strings relevant to the data.
This example uses HAM versus SPAM example email data, so the field used here isparticipants. The output suffix field can be anything because it’s used to produce the name of the new table.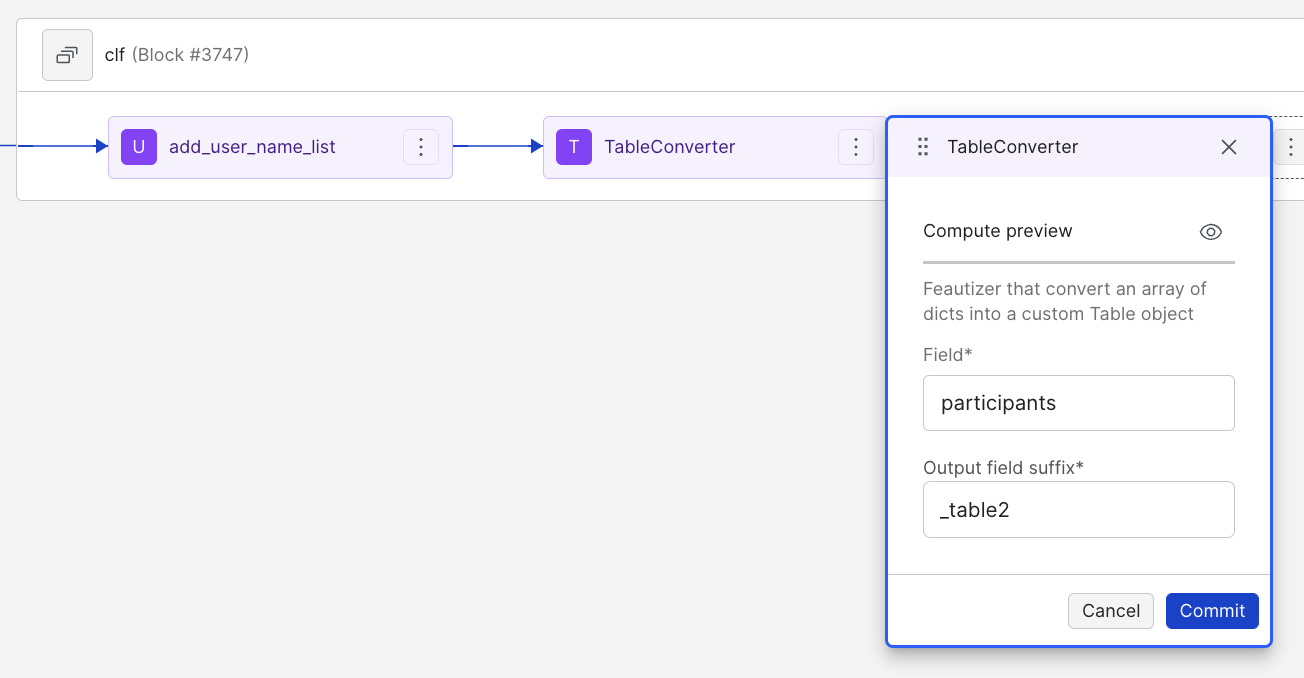
- After selecting commit, navigate back to the Application Studio.
- On the right side, scroll down to the bottom of the page to see the generated table generated. The name of the table is the
fieldandoutput field suffixfilled out in the last step.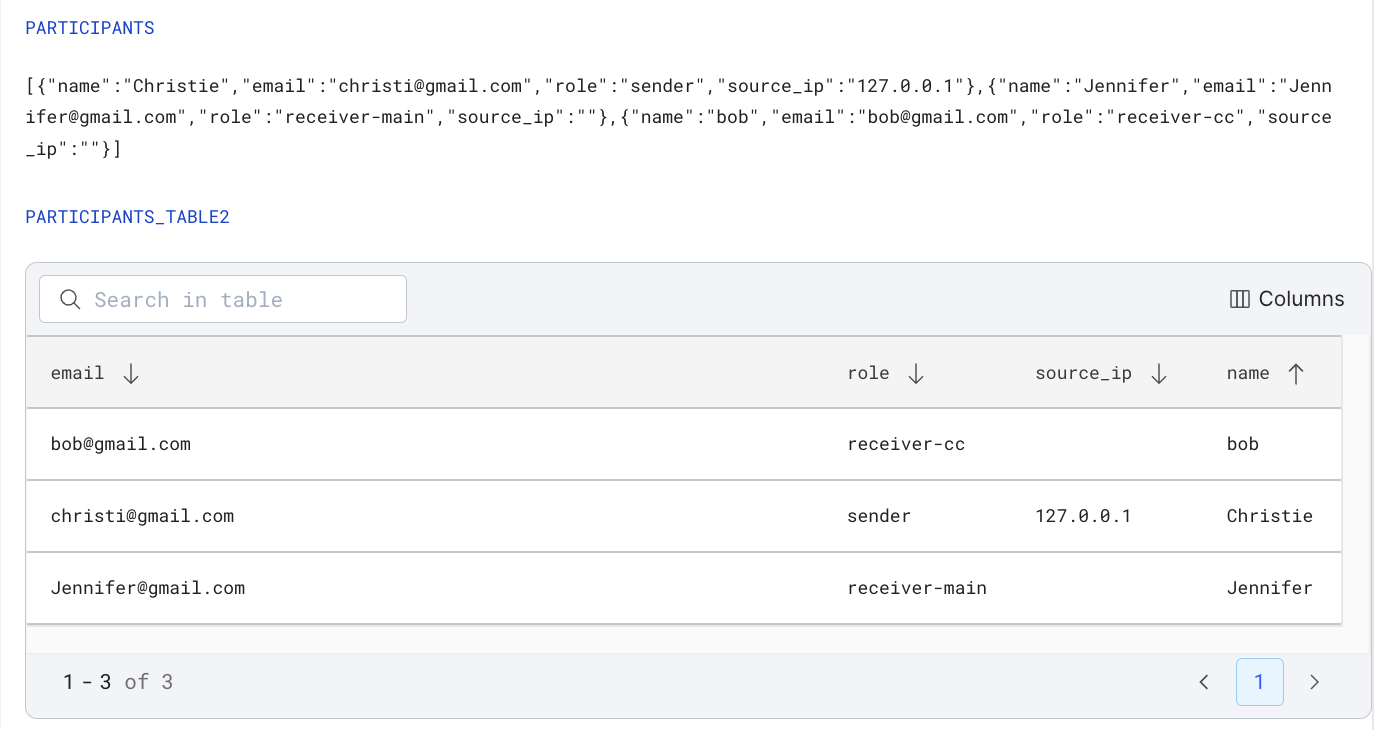
To use the data table viewer
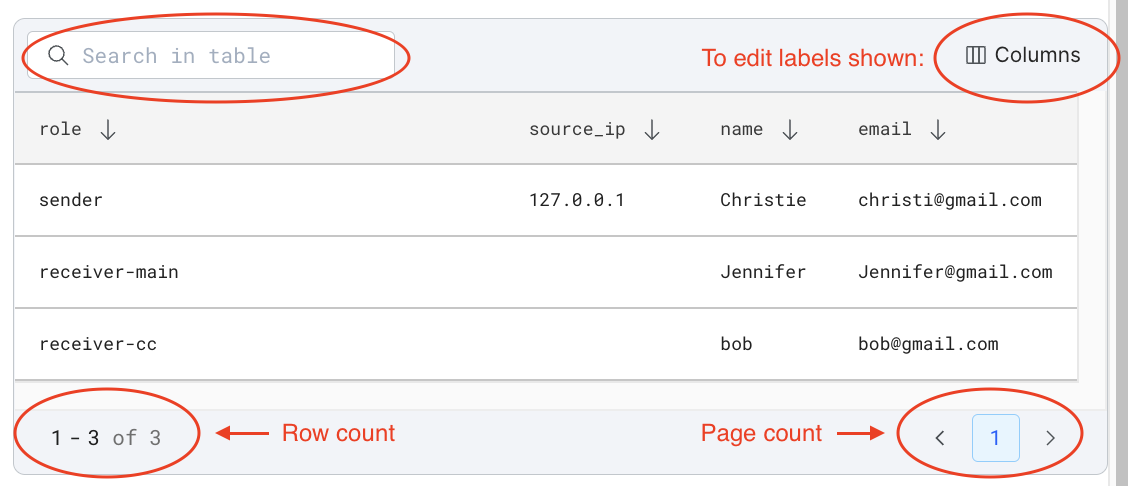
| Editing columns | To change the columns displayed by the table, select the column button in the top right corner of the table. Select (or de-select) the desired columns. The table changes its displayed elements based on your selections. |
|---|---|
| Pages | If there is enough data that more than one page is needed, move through the pages of data with the arrows in the bottom right corner. |
| Search bar | Search through the tabular view using the search bar in the top left corner using the value of any label present. |
| Row count | The number of data rows present is displayed in the bottom right corner of the table. |
| Arrows | The arrows next to each label organize the table with that label. If you set all the arrows upward, and then change one label to downward, the table will be organized based on that label. You can organize your data alphabetically, numerically, or by value based on the label selected. |
These features are highlighted in this screenshot: